29
/
en
AIzaSyAYiBZKx7MnpbEhh9jyipgxe19OcubqV5w
April 1, 2024
211334
Niger
NER
true
2
1
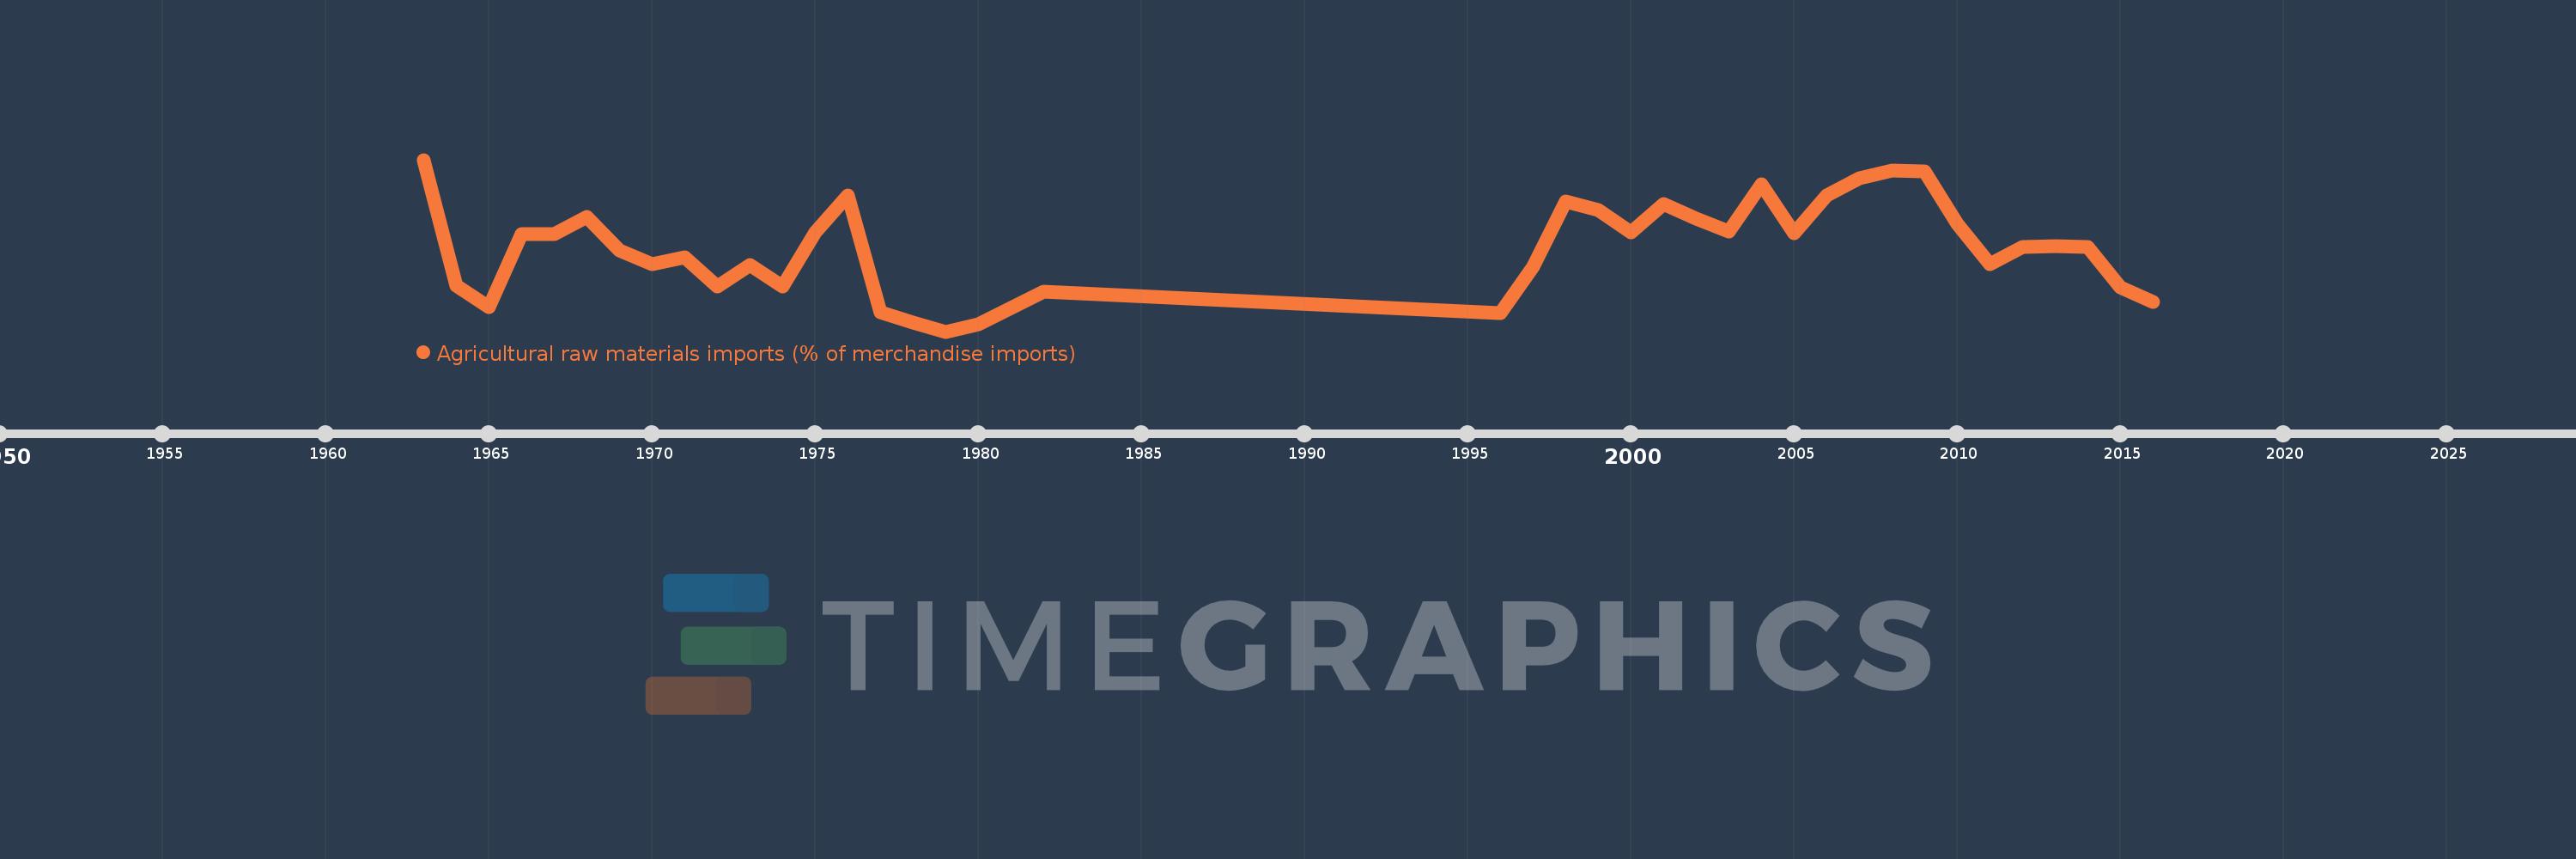
Agricultural raw materials imports (% of merchandise imports)
2016,2015,2014,2013,2012,2011,2010,2009,2008,2007,2006,2005,2004,2003,2002,2001,2000,1999,1998,1997,1996,1982,1980,1979,1978,1977,1976,1975,1974,1973,1972,1971,1970,1969,1968,1967,1966,1965,1964,1963
This statistics in other country:
AfghanistanAlbaniaAlgeriaAndorraAngolaAntigua and BarbudaArab WorldArgentinaArmeniaArubaAustraliaAustriaAzerbaijanBahamas, TheBahrainBangladeshBarbadosBelarusBelgiumBelizeBeninBermudaBhutanBoliviaBosnia and HerzegovinaBotswanaBrazilBrunei DarussalamBulgariaBurkina FasoBurundiCabo VerdeCambodiaCameroonCanadaCaribbean small statesCayman IslandsCentral African RepublicCentral Europe and the BalticsChadChileChinaColombiaComorosCongo, Dem. Rep.Congo, Rep.Costa RicaCote d'IvoireCroatiaCubaCyprusCzech RepublicDenmarkDjiboutiDominicaDominican RepublicEarly-demographic dividendEast Asia & PacificEast Asia & Pacific (excluding high income)East Asia & Pacific (IDA & IBRD countries)EcuadorEgypt, Arab Rep.El SalvadorEquatorial GuineaEritreaEstoniaEthiopiaEuro areaEurope & Central AsiaEurope & Central Asia (excluding high income)Europe & Central Asia (IDA & IBRD countries)European UnionFaroe IslandsFijiFinlandFragile and conflict affected situationsFranceFrench PolynesiaGabonGambia, TheGeorgiaGermanyGhanaGreeceGreenlandGrenadaGuatemalaGuineaGuinea-BissauGuyanaHaitiHeavily indebted poor countries (HIPC)High incomeHondurasHong Kong SAR, ChinaHungaryIBRD onlyIcelandIDA & IBRD totalIDA blendIDA onlyIDA totalIndiaIndonesiaIran, Islamic Rep.IraqIrelandIsraelItalyJamaicaJapanJordanKazakhstanKenyaKiribatiKorea, Rep.KuwaitKyrgyz RepublicLao PDRLate-demographic dividendLatin America & Caribbean Latin America & Caribbean (excluding high income)Latin America & the Caribbean (IDA & IBRD countries)LatviaLeast developed countries: UN classificationLebanonLesothoLiberiaLibyaLithuaniaLow & middle incomeLow incomeLower middle incomeLuxembourgMacao SAR, ChinaMacedonia, FYRMadagascarMalawiMalaysiaMaldivesMaliMaltaMauritaniaMauritiusMexicoMiddle East & North AfricaMiddle East & North Africa (excluding high income)Middle East & North Africa (IDA & IBRD countries)Middle incomeMoldovaMongoliaMoroccoMozambiqueMyanmarNamibiaNepalNetherlandsNew CaledoniaNew ZealandNicaraguaNigerNigeriaNorth AmericaNorwayOECD membersOmanOther small statesPacific island small statesPakistanPalauPanamaPapua New GuineaParaguayPeruPhilippinesPolandPortugalPost-demographic dividendPre-demographic dividendQatarRomaniaRussian FederationRwandaSamoaSao Tome and PrincipeSaudi ArabiaSenegalSerbiaSeychellesSierra LeoneSingaporeSlovak RepublicSloveniaSmall statesSolomon IslandsSomaliaSouth AfricaSouth AsiaSouth Asia (IDA & IBRD)SpainSri LankaSt. Kitts and NevisSt. LuciaSt. Vincent and the GrenadinesSub-Saharan Africa Sub-Saharan Africa (excluding high income)Sub-Saharan Africa (IDA & IBRD countries)SudanSurinameSwazilandSwedenSwitzerlandSyrian Arab RepublicTajikistanTanzaniaThailandTimor-LesteTogoTongaTrinidad and TobagoTunisiaTurkeyTurkmenistanTurks and Caicos IslandsTuvaluUgandaUkraineUnited Arab EmiratesUnited KingdomUnited StatesUpper middle incomeUruguayVanuatuVenezuela, RBVietnamVirgin Islands (U.S.)WorldYemen, Rep.ZambiaZimbabwe Timeline:
This timeline shows a graph from 1963 to 2016 of Niger. No data until 1962. Number of actual observations by date: 40.
Source name:
World Development Indicators
Source organization:
World Bank staff estimates from the Comtrade database maintained by the United Nations Statistics Division.
Categories, topics:
Agriculture & Rural Development, Private Sector, Trade
Last updated:
apr 23, 2017
Indicators value changes by year
At the date of observation
Value
Absolute change
Change from previous value
jan 1, 1963
5.023
+5.023
0.0%
jan 1, 1964
1.475
-3.548
-70.63%
jan 1, 1965
0.873
-0.602
-40.8%
jan 1, 1966
2.939
+2.065
236.47%
jan 1, 1967
2.94
+0.002
0.05%
jan 1, 1968
3.41
+0.469
15.97%
jan 1, 1969
2.461
-0.948
-27.81%
jan 1, 1970
2.082
-0.38
-15.42%
jan 1, 1971
2.288
+0.206
9.91%
jan 1, 1972
1.461
-0.827
-36.14%
jan 1, 1973
2.072
+0.61
41.78%
jan 1, 1974
1.449
-0.623
-30.07%
jan 1, 1975
2.971
+1.523
105.1%
jan 1, 1976
4.009
+1.037
34.91%
jan 1, 1977
0.744
-3.265
-81.44%
jan 1, 1978
0.438
-0.306
-41.16%
jan 1, 1979
0.188
-0.25
-57.13%
jan 1, 1980
0.395
+0.207
110.53%
jan 1, 1982
1.317
+0.922
233.32%
jan 1, 1996
0.719
-0.598
-45.42%
jan 1, 1997
2.019
+1.3
180.87%
jan 1, 1998
3.853
+1.834
90.86%
jan 1, 1999
3.606
-0.248
-6.43%
jan 1, 2000
2.982
-0.623
-17.29%
jan 1, 2001
3.779
+0.797
26.72%
jan 1, 2002
3.358
-0.422
-11.15%
jan 1, 2003
3.014
-0.344
-10.25%
jan 1, 2004
4.327
+1.313
43.58%
jan 1, 2005
2.959
-1.368
-31.61%
jan 1, 2006
4.02
+1.061
35.85%
jan 1, 2007
4.495
+0.475
11.82%
jan 1, 2008
4.713
+0.218
4.86%
jan 1, 2009
4.707
-0.006
-0.13%
jan 1, 2010
3.212
-1.495
-31.75%
jan 1, 2011
2.092
-1.121
-34.89%
jan 1, 2012
2.575
+0.483
23.09%
jan 1, 2013
2.597
+0.022
0.86%
jan 1, 2014
2.558
-0.039
-1.51%
jan 1, 2015
1.427
-1.13
-44.2%
jan 1, 2016
1.022
-0.405
-28.4%
Ranking of countries by current statistics by years


Comments: