29
/
en
AIzaSyAYiBZKx7MnpbEhh9jyipgxe19OcubqV5w
April 1, 2024
235346
Senegal
SEN
true
2
1
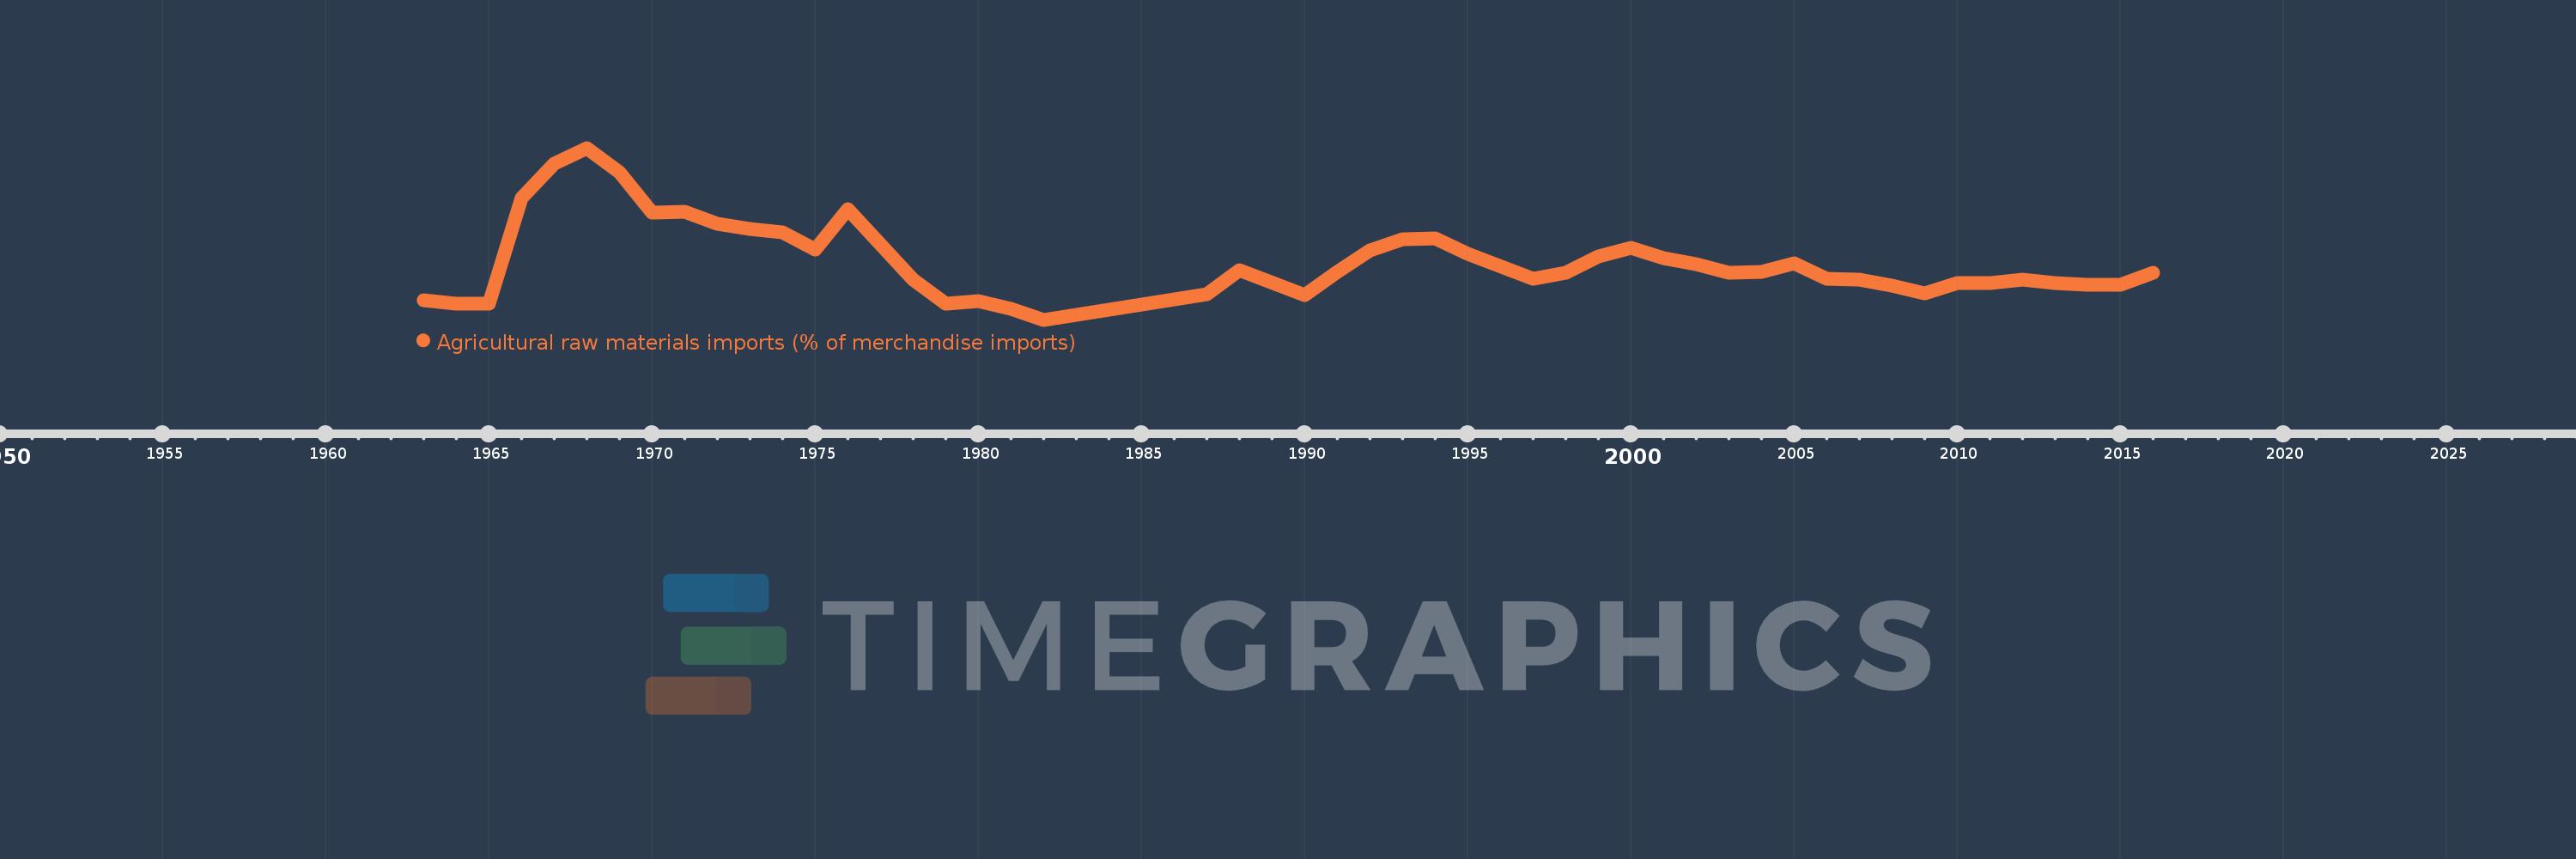
Agricultural raw materials imports (% of merchandise imports)
2016,2015,2014,2013,2012,2011,2010,2009,2008,2007,2006,2005,2004,2003,2002,2001,2000,1999,1998,1997,1995,1994,1993,1992,1991,1990,1988,1987,1982,1981,1980,1979,1978,1976,1975,1974,1973,1972,1971,1970,1969,1968,1967,1966,1965,1964,1963
This statistics in other country:
AfghanistanAlbaniaAlgeriaAndorraAngolaAntigua and BarbudaArab WorldArgentinaArmeniaArubaAustraliaAustriaAzerbaijanBahamas, TheBahrainBangladeshBarbadosBelarusBelgiumBelizeBeninBermudaBhutanBoliviaBosnia and HerzegovinaBotswanaBrazilBrunei DarussalamBulgariaBurkina FasoBurundiCabo VerdeCambodiaCameroonCanadaCaribbean small statesCayman IslandsCentral African RepublicCentral Europe and the BalticsChadChileChinaColombiaComorosCongo, Dem. Rep.Congo, Rep.Costa RicaCote d'IvoireCroatiaCubaCyprusCzech RepublicDenmarkDjiboutiDominicaDominican RepublicEarly-demographic dividendEast Asia & PacificEast Asia & Pacific (excluding high income)East Asia & Pacific (IDA & IBRD countries)EcuadorEgypt, Arab Rep.El SalvadorEquatorial GuineaEritreaEstoniaEthiopiaEuro areaEurope & Central AsiaEurope & Central Asia (excluding high income)Europe & Central Asia (IDA & IBRD countries)European UnionFaroe IslandsFijiFinlandFragile and conflict affected situationsFranceFrench PolynesiaGabonGambia, TheGeorgiaGermanyGhanaGreeceGreenlandGrenadaGuatemalaGuineaGuinea-BissauGuyanaHaitiHeavily indebted poor countries (HIPC)High incomeHondurasHong Kong SAR, ChinaHungaryIBRD onlyIcelandIDA & IBRD totalIDA blendIDA onlyIDA totalIndiaIndonesiaIran, Islamic Rep.IraqIrelandIsraelItalyJamaicaJapanJordanKazakhstanKenyaKiribatiKorea, Rep.KuwaitKyrgyz RepublicLao PDRLate-demographic dividendLatin America & Caribbean Latin America & Caribbean (excluding high income)Latin America & the Caribbean (IDA & IBRD countries)LatviaLeast developed countries: UN classificationLebanonLesothoLiberiaLibyaLithuaniaLow & middle incomeLow incomeLower middle incomeLuxembourgMacao SAR, ChinaMacedonia, FYRMadagascarMalawiMalaysiaMaldivesMaliMaltaMauritaniaMauritiusMexicoMiddle East & North AfricaMiddle East & North Africa (excluding high income)Middle East & North Africa (IDA & IBRD countries)Middle incomeMoldovaMongoliaMoroccoMozambiqueMyanmarNamibiaNepalNetherlandsNew CaledoniaNew ZealandNicaraguaNigerNigeriaNorth AmericaNorwayOECD membersOmanOther small statesPacific island small statesPakistanPalauPanamaPapua New GuineaParaguayPeruPhilippinesPolandPortugalPost-demographic dividendPre-demographic dividendQatarRomaniaRussian FederationRwandaSamoaSao Tome and PrincipeSaudi ArabiaSenegalSerbiaSeychellesSierra LeoneSingaporeSlovak RepublicSloveniaSmall statesSolomon IslandsSomaliaSouth AfricaSouth AsiaSouth Asia (IDA & IBRD)SpainSri LankaSt. Kitts and NevisSt. LuciaSt. Vincent and the GrenadinesSub-Saharan Africa Sub-Saharan Africa (excluding high income)Sub-Saharan Africa (IDA & IBRD countries)SudanSurinameSwazilandSwedenSwitzerlandSyrian Arab RepublicTajikistanTanzaniaThailandTimor-LesteTogoTongaTrinidad and TobagoTunisiaTurkeyTurkmenistanTurks and Caicos IslandsTuvaluUgandaUkraineUnited Arab EmiratesUnited KingdomUnited StatesUpper middle incomeUruguayVanuatuVenezuela, RBVietnamVirgin Islands (U.S.)WorldYemen, Rep.ZambiaZimbabwe Timeline:
This timeline shows a graph from 1963 to 2016 of Senegal. No data until 1962. Number of actual observations by date: 47.
Source name:
World Development Indicators
Source organization:
World Bank staff estimates from the Comtrade database maintained by the United Nations Statistics Division.
Categories, topics:
Agriculture & Rural Development, Private Sector, Trade
Last updated:
apr 23, 2017
Indicators value changes by year
At the date of observation
Value
Absolute change
Change from previous value
jan 1, 1963
1.136
+1.136
0.0%
jan 1, 1964
1.069
-0.067
-5.93%
jan 1, 1965
1.06
-0.009
-0.8%
jan 1, 1966
3.406
+2.345
221.2%
jan 1, 1967
4.171
+0.766
22.48%
jan 1, 1968
4.528
+0.357
8.55%
jan 1, 1969
3.982
-0.546
-12.06%
jan 1, 1970
3.086
-0.896
-22.5%
jan 1, 1971
3.1
+0.014
0.45%
jan 1, 1972
2.84
-0.26
-8.38%
jan 1, 1973
2.727
-0.113
-3.99%
jan 1, 1974
2.642
-0.085
-3.11%
jan 1, 1975
2.269
-0.373
-14.11%
jan 1, 1976
3.164
+0.894
39.41%
jan 1, 1978
1.605
-1.558
-49.26%
jan 1, 1979
1.057
-0.548
-34.16%
jan 1, 1980
1.126
+0.069
6.52%
jan 1, 1981
0.947
-0.179
-15.87%
jan 1, 1982
0.707
-0.24
-25.39%
jan 1, 1987
1.267
+0.56
79.28%
jan 1, 1988
1.8
+0.533
42.1%
jan 1, 1990
1.26
-0.54
-30.02%
jan 1, 1991
1.778
+0.518
41.15%
jan 1, 1992
2.254
+0.475
26.74%
jan 1, 1993
2.488
+0.234
10.38%
jan 1, 1994
2.521
+0.034
1.35%
jan 1, 1995
2.163
-0.358
-14.19%
jan 1, 1997
1.619
-0.544
-25.15%
jan 1, 1998
1.752
+0.133
8.21%
jan 1, 1999
2.116
+0.364
20.75%
jan 1, 2000
2.315
+0.199
9.41%
jan 1, 2001
2.073
-0.242
-10.45%
jan 1, 2002
1.937
-0.136
-6.55%
jan 1, 2003
1.754
-0.183
-9.46%
jan 1, 2004
1.762
+0.008
0.46%
jan 1, 2005
1.962
+0.2
11.35%
jan 1, 2006
1.626
-0.336
-17.1%
jan 1, 2007
1.608
-0.018
-1.12%
jan 1, 2008
1.458
-0.15
-9.33%
jan 1, 2009
1.295
-0.163
-11.21%
jan 1, 2010
1.526
+0.231
17.86%
jan 1, 2011
1.517
-0.009
-0.58%
jan 1, 2012
1.605
+0.088
5.8%
jan 1, 2013
1.522
-0.083
-5.17%
jan 1, 2014
1.485
-0.037
-2.44%
jan 1, 2015
1.489
+0.004
0.29%
jan 1, 2016
1.752
+0.263
17.64%
Ranking of countries by current statistics by years


Comments: