29
/
en
AIzaSyAYiBZKx7MnpbEhh9jyipgxe19OcubqV5w
April 1, 2024
125780
El Salvador
SLV
true
2
1
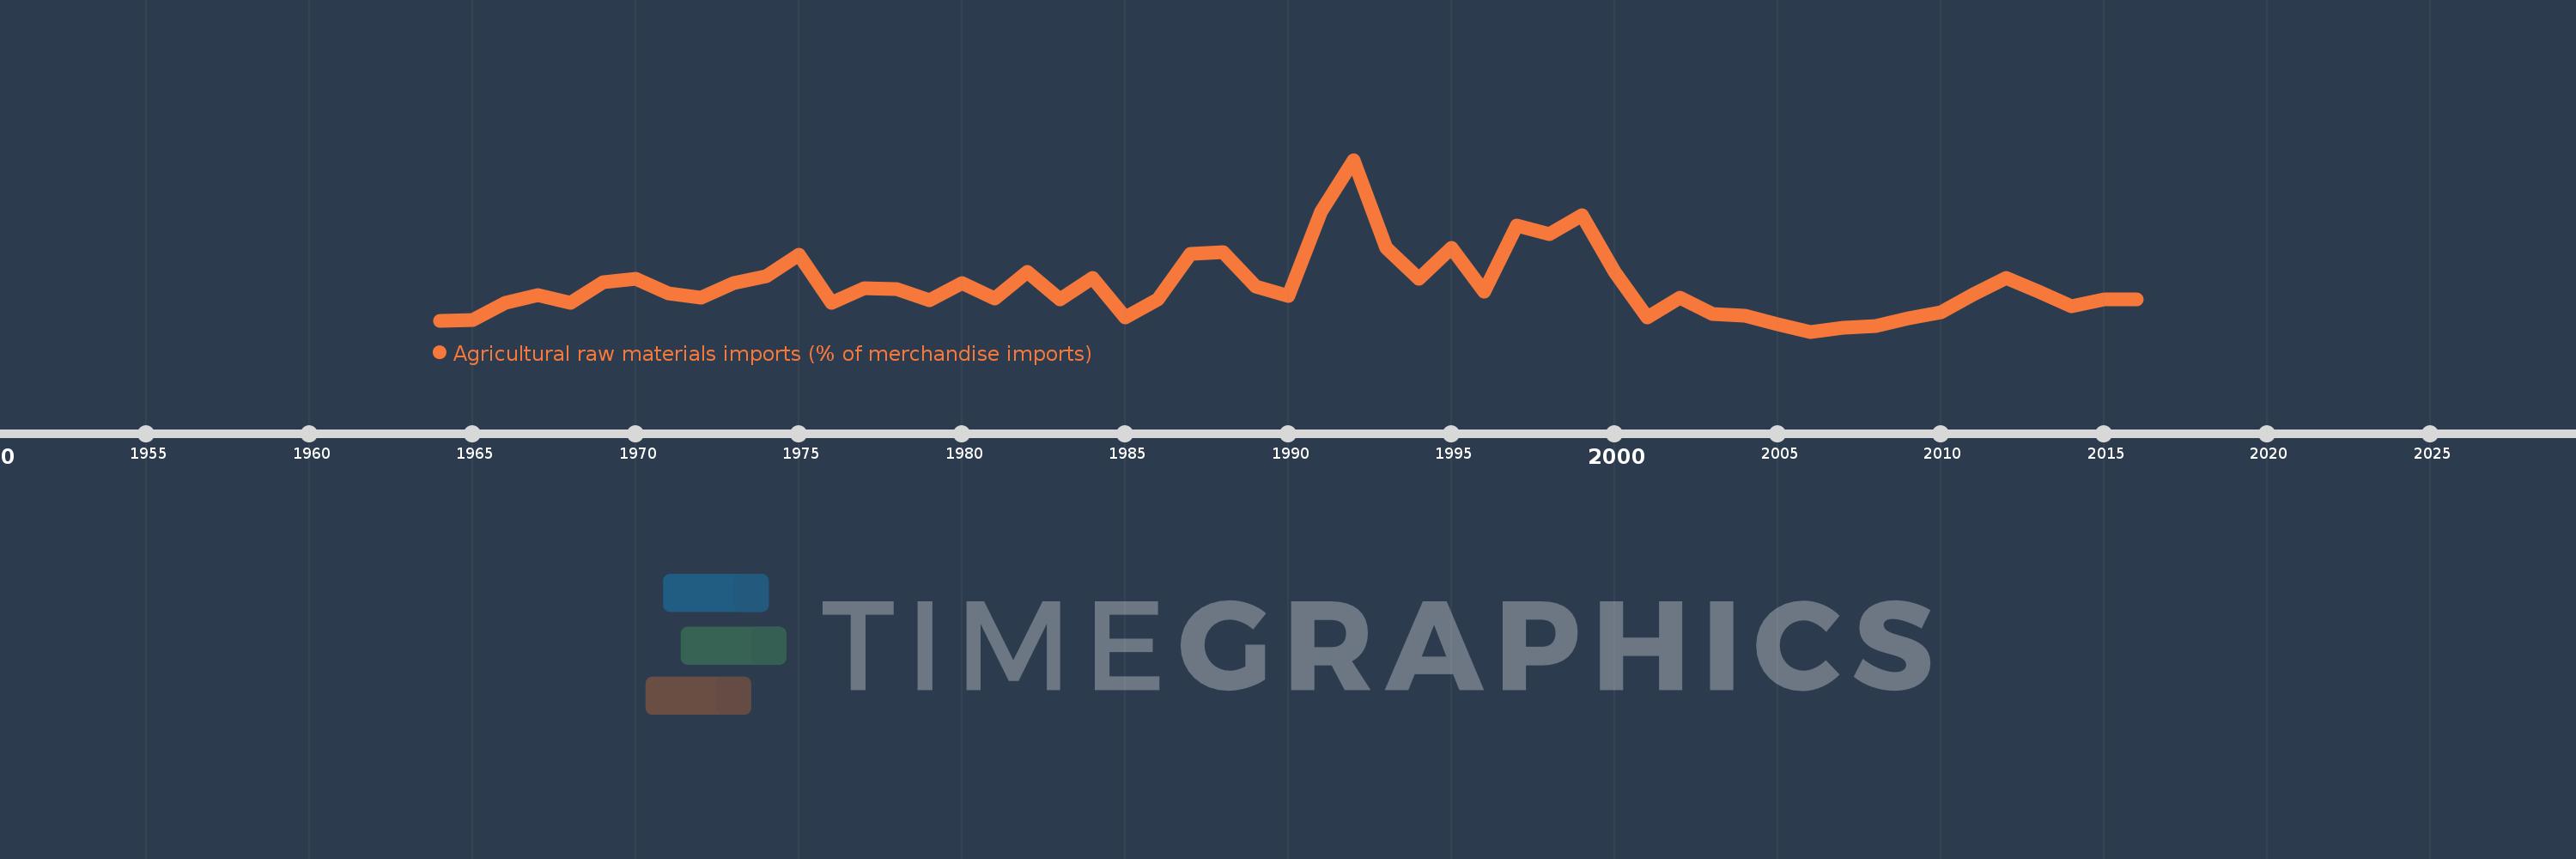
Agricultural raw materials imports (% of merchandise imports)
2016,2015,2014,2013,2012,2011,2010,2009,2008,2007,2006,2005,2004,2003,2002,2001,2000,1999,1998,1997,1996,1995,1994,1993,1992,1991,1990,1989,1988,1987,1986,1985,1984,1983,1982,1981,1980,1979,1978,1977,1976,1975,1974,1973,1972,1971,1970,1969,1968,1967,1966,1965,1964
This statistics in other country:
AfghanistanAlbaniaAlgeriaAndorraAngolaAntigua and BarbudaArab WorldArgentinaArmeniaArubaAustraliaAustriaAzerbaijanBahamas, TheBahrainBangladeshBarbadosBelarusBelgiumBelizeBeninBermudaBhutanBoliviaBosnia and HerzegovinaBotswanaBrazilBrunei DarussalamBulgariaBurkina FasoBurundiCabo VerdeCambodiaCameroonCanadaCaribbean small statesCayman IslandsCentral African RepublicCentral Europe and the BalticsChadChileChinaColombiaComorosCongo, Dem. Rep.Congo, Rep.Costa RicaCote d'IvoireCroatiaCubaCyprusCzech RepublicDenmarkDjiboutiDominicaDominican RepublicEarly-demographic dividendEast Asia & PacificEast Asia & Pacific (excluding high income)East Asia & Pacific (IDA & IBRD countries)EcuadorEgypt, Arab Rep.El SalvadorEquatorial GuineaEritreaEstoniaEthiopiaEuro areaEurope & Central AsiaEurope & Central Asia (excluding high income)Europe & Central Asia (IDA & IBRD countries)European UnionFaroe IslandsFijiFinlandFragile and conflict affected situationsFranceFrench PolynesiaGabonGambia, TheGeorgiaGermanyGhanaGreeceGreenlandGrenadaGuatemalaGuineaGuinea-BissauGuyanaHaitiHeavily indebted poor countries (HIPC)High incomeHondurasHong Kong SAR, ChinaHungaryIBRD onlyIcelandIDA & IBRD totalIDA blendIDA onlyIDA totalIndiaIndonesiaIran, Islamic Rep.IraqIrelandIsraelItalyJamaicaJapanJordanKazakhstanKenyaKiribatiKorea, Rep.KuwaitKyrgyz RepublicLao PDRLate-demographic dividendLatin America & Caribbean Latin America & Caribbean (excluding high income)Latin America & the Caribbean (IDA & IBRD countries)LatviaLeast developed countries: UN classificationLebanonLesothoLiberiaLibyaLithuaniaLow & middle incomeLow incomeLower middle incomeLuxembourgMacao SAR, ChinaMacedonia, FYRMadagascarMalawiMalaysiaMaldivesMaliMaltaMauritaniaMauritiusMexicoMiddle East & North AfricaMiddle East & North Africa (excluding high income)Middle East & North Africa (IDA & IBRD countries)Middle incomeMoldovaMongoliaMoroccoMozambiqueMyanmarNamibiaNepalNetherlandsNew CaledoniaNew ZealandNicaraguaNigerNigeriaNorth AmericaNorwayOECD membersOmanOther small statesPacific island small statesPakistanPalauPanamaPapua New GuineaParaguayPeruPhilippinesPolandPortugalPost-demographic dividendPre-demographic dividendQatarRomaniaRussian FederationRwandaSamoaSao Tome and PrincipeSaudi ArabiaSenegalSerbiaSeychellesSierra LeoneSingaporeSlovak RepublicSloveniaSmall statesSolomon IslandsSomaliaSouth AfricaSouth AsiaSouth Asia (IDA & IBRD)SpainSri LankaSt. Kitts and NevisSt. LuciaSt. Vincent and the GrenadinesSub-Saharan Africa Sub-Saharan Africa (excluding high income)Sub-Saharan Africa (IDA & IBRD countries)SudanSurinameSwazilandSwedenSwitzerlandSyrian Arab RepublicTajikistanTanzaniaThailandTimor-LesteTogoTongaTrinidad and TobagoTunisiaTurkeyTurkmenistanTurks and Caicos IslandsTuvaluUgandaUkraineUnited Arab EmiratesUnited KingdomUnited StatesUpper middle incomeUruguayVanuatuVenezuela, RBVietnamVirgin Islands (U.S.)WorldYemen, Rep.ZambiaZimbabwe Timeline:
This timeline shows a graph from 1964 to 2016 of El Salvador. No data until 1963. Number of actual observations by date: 53.
Source name:
World Development Indicators
Source organization:
World Bank staff estimates from the Comtrade database maintained by the United Nations Statistics Division.
Categories, topics:
Agriculture & Rural Development, Private Sector, Trade
Last updated:
apr 23, 2017
Indicators value changes by year
At the date of observation
Value
Absolute change
Change from previous value
jan 1, 1964
1.516
+1.516
0.0%
jan 1, 1965
1.531
+0.014
0.95%
jan 1, 1966
1.802
+0.272
17.74%
jan 1, 1967
1.928
+0.126
7.01%
jan 1, 1968
1.802
-0.126
-6.53%
jan 1, 1969
2.151
+0.349
19.36%
jan 1, 1970
2.206
+0.054
2.53%
jan 1, 1971
1.956
-0.25
-11.33%
jan 1, 1972
1.886
-0.07
-3.57%
jan 1, 1973
2.134
+0.248
13.15%
jan 1, 1974
2.237
+0.102
4.8%
jan 1, 1975
2.588
+0.351
15.7%
jan 1, 1976
1.801
-0.786
-30.38%
jan 1, 1977
2.051
+0.25
13.88%
jan 1, 1978
2.034
-0.017
-0.82%
jan 1, 1979
1.855
-0.18
-8.83%
jan 1, 1980
2.136
+0.281
15.13%
jan 1, 1981
1.879
-0.256
-12.0%
jan 1, 1982
2.31
+0.43
22.91%
jan 1, 1983
1.866
-0.444
-19.23%
jan 1, 1984
2.215
+0.35
18.75%
jan 1, 1985
1.563
-0.652
-29.45%
jan 1, 1986
1.857
+0.294
18.8%
jan 1, 1987
2.607
+0.75
40.41%
jan 1, 1988
2.634
+0.027
1.03%
jan 1, 1989
2.077
-0.557
-21.15%
jan 1, 1990
1.92
-0.157
-7.54%
jan 1, 1991
3.292
+1.372
71.47%
jan 1, 1992
4.147
+0.855
25.97%
jan 1, 1993
2.713
-1.434
-34.59%
jan 1, 1994
2.206
-0.507
-18.7%
jan 1, 1995
2.704
+0.498
22.59%
jan 1, 1996
1.988
-0.716
-26.46%
jan 1, 1997
3.074
+1.086
54.6%
jan 1, 1998
2.925
-0.149
-4.86%
jan 1, 1999
3.243
+0.318
10.86%
jan 1, 2000
2.307
-0.935
-28.84%
jan 1, 2001
1.562
-0.745
-32.3%
jan 1, 2002
1.887
+0.325
20.78%
jan 1, 2003
1.621
-0.266
-14.1%
jan 1, 2004
1.599
-0.022
-1.35%
jan 1, 2005
1.46
-0.139
-8.69%
jan 1, 2006
1.336
-0.124
-8.51%
jan 1, 2007
1.4
+0.064
4.79%
jan 1, 2008
1.421
+0.022
1.56%
jan 1, 2009
1.547
+0.125
8.82%
jan 1, 2010
1.659
+0.112
7.25%
jan 1, 2011
1.949
+0.29
17.48%
jan 1, 2012
2.218
+0.269
13.81%
jan 1, 2013
1.983
-0.235
-10.58%
jan 1, 2014
1.756
-0.227
-11.46%
jan 1, 2015
1.867
+0.111
6.31%
jan 1, 2016
1.87
+0.004
0.19%
Ranking of countries by current statistics by years


Comments: