29
/
en
AIzaSyAYiBZKx7MnpbEhh9jyipgxe19OcubqV5w
April 1, 2024
227154
Qatar
QAT
true
2
1
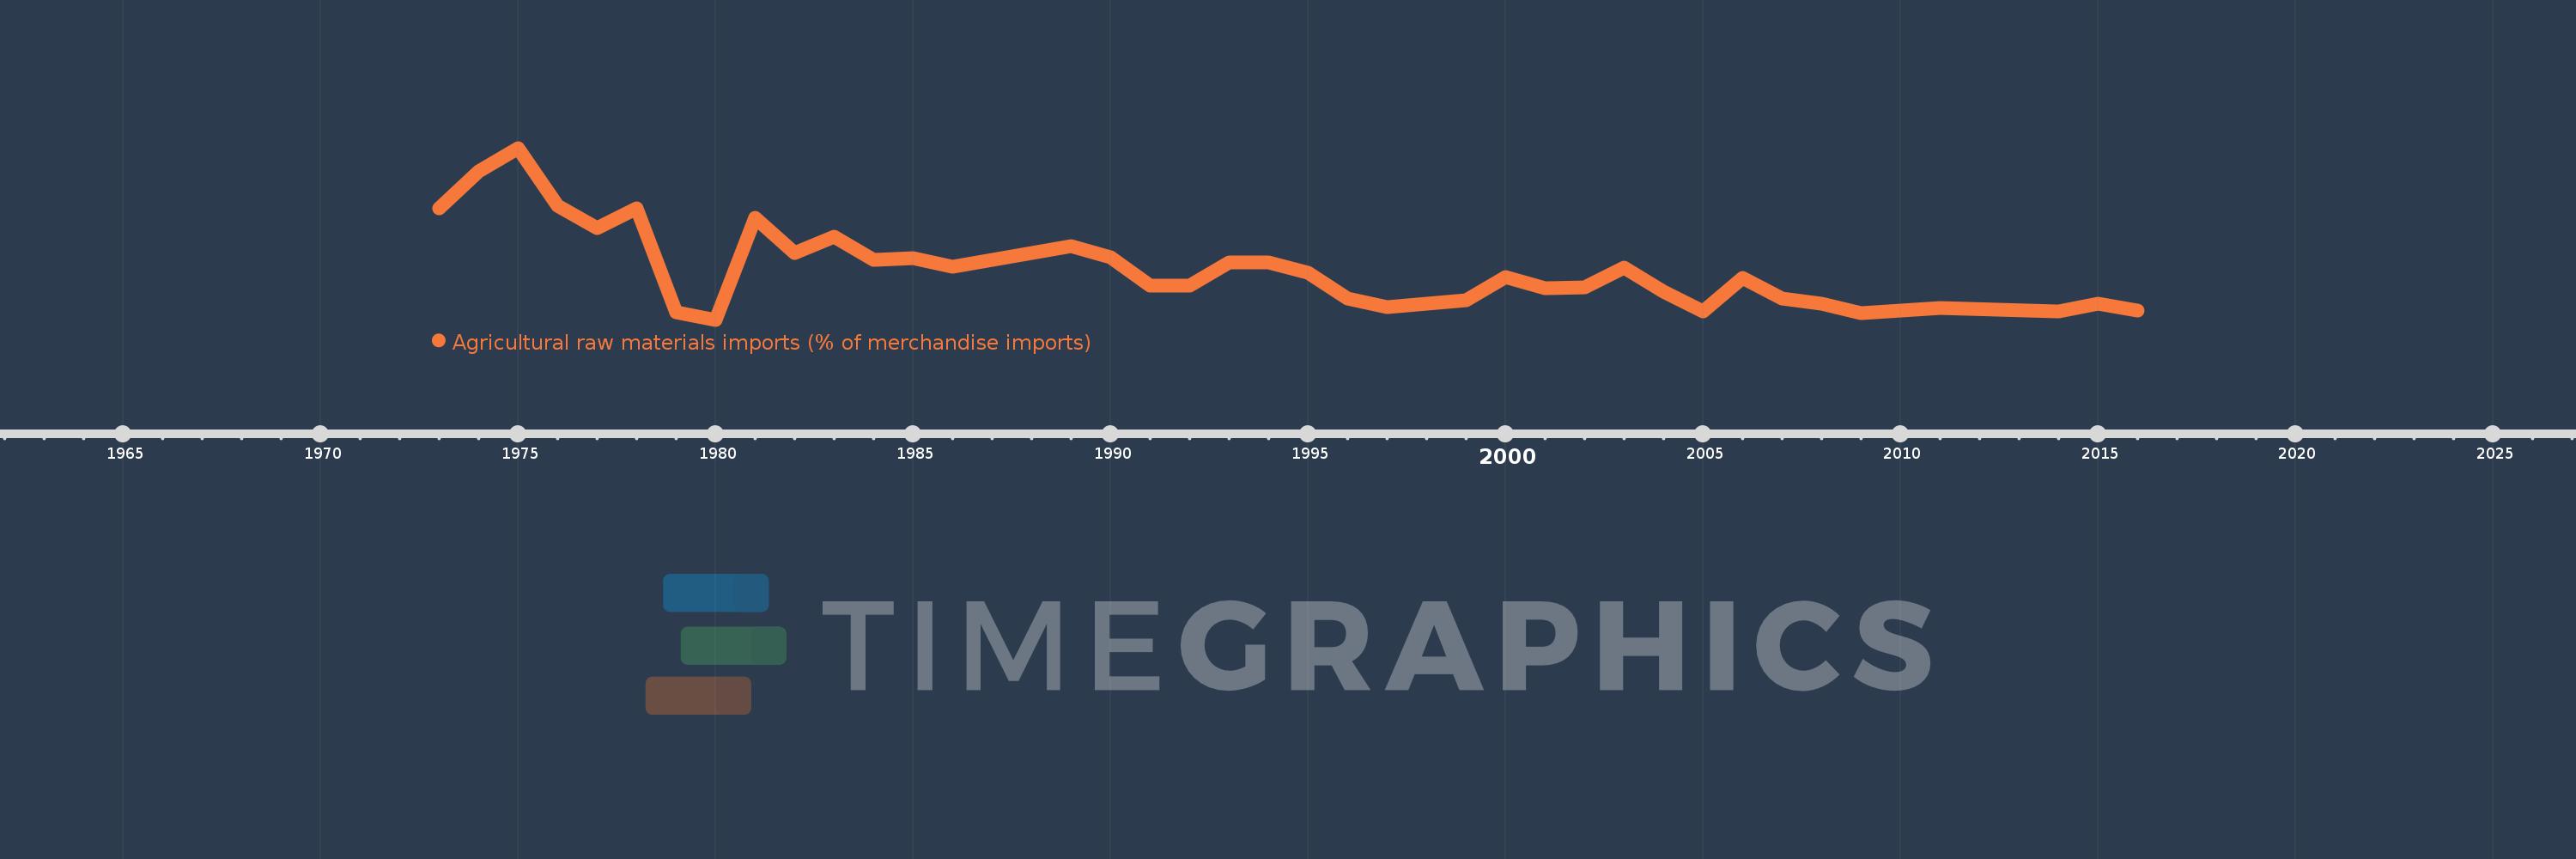
Agricultural raw materials imports (% of merchandise imports)
2016,2015,2014,2011,2009,2008,2007,2006,2005,2004,2003,2002,2001,2000,1999,1997,1996,1995,1994,1993,1992,1991,1990,1989,1986,1985,1984,1983,1982,1981,1980,1979,1978,1977,1976,1975,1974,1973
This statistics in other country:
AfghanistanAlbaniaAlgeriaAndorraAngolaAntigua and BarbudaArab WorldArgentinaArmeniaArubaAustraliaAustriaAzerbaijanBahamas, TheBahrainBangladeshBarbadosBelarusBelgiumBelizeBeninBermudaBhutanBoliviaBosnia and HerzegovinaBotswanaBrazilBrunei DarussalamBulgariaBurkina FasoBurundiCabo VerdeCambodiaCameroonCanadaCaribbean small statesCayman IslandsCentral African RepublicCentral Europe and the BalticsChadChileChinaColombiaComorosCongo, Dem. Rep.Congo, Rep.Costa RicaCote d'IvoireCroatiaCubaCyprusCzech RepublicDenmarkDjiboutiDominicaDominican RepublicEarly-demographic dividendEast Asia & PacificEast Asia & Pacific (excluding high income)East Asia & Pacific (IDA & IBRD countries)EcuadorEgypt, Arab Rep.El SalvadorEquatorial GuineaEritreaEstoniaEthiopiaEuro areaEurope & Central AsiaEurope & Central Asia (excluding high income)Europe & Central Asia (IDA & IBRD countries)European UnionFaroe IslandsFijiFinlandFragile and conflict affected situationsFranceFrench PolynesiaGabonGambia, TheGeorgiaGermanyGhanaGreeceGreenlandGrenadaGuatemalaGuineaGuinea-BissauGuyanaHaitiHeavily indebted poor countries (HIPC)High incomeHondurasHong Kong SAR, ChinaHungaryIBRD onlyIcelandIDA & IBRD totalIDA blendIDA onlyIDA totalIndiaIndonesiaIran, Islamic Rep.IraqIrelandIsraelItalyJamaicaJapanJordanKazakhstanKenyaKiribatiKorea, Rep.KuwaitKyrgyz RepublicLao PDRLate-demographic dividendLatin America & Caribbean Latin America & Caribbean (excluding high income)Latin America & the Caribbean (IDA & IBRD countries)LatviaLeast developed countries: UN classificationLebanonLesothoLiberiaLibyaLithuaniaLow & middle incomeLow incomeLower middle incomeLuxembourgMacao SAR, ChinaMacedonia, FYRMadagascarMalawiMalaysiaMaldivesMaliMaltaMauritaniaMauritiusMexicoMiddle East & North AfricaMiddle East & North Africa (excluding high income)Middle East & North Africa (IDA & IBRD countries)Middle incomeMoldovaMongoliaMoroccoMozambiqueMyanmarNamibiaNepalNetherlandsNew CaledoniaNew ZealandNicaraguaNigerNigeriaNorth AmericaNorwayOECD membersOmanOther small statesPacific island small statesPakistanPalauPanamaPapua New GuineaParaguayPeruPhilippinesPolandPortugalPost-demographic dividendPre-demographic dividendQatarRomaniaRussian FederationRwandaSamoaSao Tome and PrincipeSaudi ArabiaSenegalSerbiaSeychellesSierra LeoneSingaporeSlovak RepublicSloveniaSmall statesSolomon IslandsSomaliaSouth AfricaSouth AsiaSouth Asia (IDA & IBRD)SpainSri LankaSt. Kitts and NevisSt. LuciaSt. Vincent and the GrenadinesSub-Saharan Africa Sub-Saharan Africa (excluding high income)Sub-Saharan Africa (IDA & IBRD countries)SudanSurinameSwazilandSwedenSwitzerlandSyrian Arab RepublicTajikistanTanzaniaThailandTimor-LesteTogoTongaTrinidad and TobagoTunisiaTurkeyTurkmenistanTurks and Caicos IslandsTuvaluUgandaUkraineUnited Arab EmiratesUnited KingdomUnited StatesUpper middle incomeUruguayVanuatuVenezuela, RBVietnamVirgin Islands (U.S.)WorldYemen, Rep.ZambiaZimbabwe Timeline:
This timeline shows a graph from 1973 to 2016 of Qatar. No data until 1972. Number of actual observations by date: 38.
Source name:
World Development Indicators
Source organization:
World Bank staff estimates from the Comtrade database maintained by the United Nations Statistics Division.
Categories, topics:
Agriculture & Rural Development, Private Sector, Trade
Last updated:
apr 23, 2017
Indicators value changes by year
At the date of observation
Value
Absolute change
Change from previous value
jan 1, 1973
1.197
+1.197
0.0%
jan 1, 1974
1.459
+0.262
21.88%
jan 1, 1975
1.621
+0.162
11.11%
jan 1, 1976
1.218
-0.402
-24.82%
jan 1, 1977
1.058
-0.161
-13.19%
jan 1, 1978
1.2
+0.142
13.46%
jan 1, 1979
0.469
-0.731
-60.9%
jan 1, 1980
0.418
-0.051
-10.93%
jan 1, 1981
1.133
+0.715
171.03%
jan 1, 1982
0.885
-0.248
-21.88%
jan 1, 1983
1.002
+0.117
13.23%
jan 1, 1984
0.839
-0.163
-16.26%
jan 1, 1985
0.847
+0.008
0.96%
jan 1, 1986
0.792
-0.056
-6.56%
jan 1, 1989
0.931
+0.139
17.55%
jan 1, 1990
0.856
-0.075
-8.03%
jan 1, 1991
0.659
-0.197
-22.98%
jan 1, 1992
0.654
-0.005
-0.73%
jan 1, 1993
0.822
+0.168
25.69%
jan 1, 1994
0.818
-0.005
-0.57%
jan 1, 1995
0.746
-0.072
-8.77%
jan 1, 1996
0.565
-0.181
-24.23%
jan 1, 1997
0.504
-0.061
-10.76%
jan 1, 1999
0.555
+0.051
10.05%
jan 1, 2000
0.715
+0.16
28.75%
jan 1, 2001
0.638
-0.077
-10.79%
jan 1, 2002
0.645
+0.007
1.12%
jan 1, 2003
0.784
+0.139
21.51%
jan 1, 2004
0.617
-0.167
-21.3%
jan 1, 2005
0.474
-0.143
-23.12%
jan 1, 2006
0.71
+0.236
49.68%
jan 1, 2007
0.567
-0.142
-20.07%
jan 1, 2008
0.529
-0.038
-6.67%
jan 1, 2009
0.465
-0.064
-12.12%
jan 1, 2011
0.499
+0.034
7.22%
jan 1, 2014
0.475
-0.024
-4.84%
jan 1, 2015
0.533
+0.058
12.22%
jan 1, 2016
0.482
-0.051
-9.58%
Ranking of countries by current statistics by years


Comments: