29
/
en
AIzaSyAYiBZKx7MnpbEhh9jyipgxe19OcubqV5w
April 1, 2024
248304
Sri Lanka
LKA
true
2
1
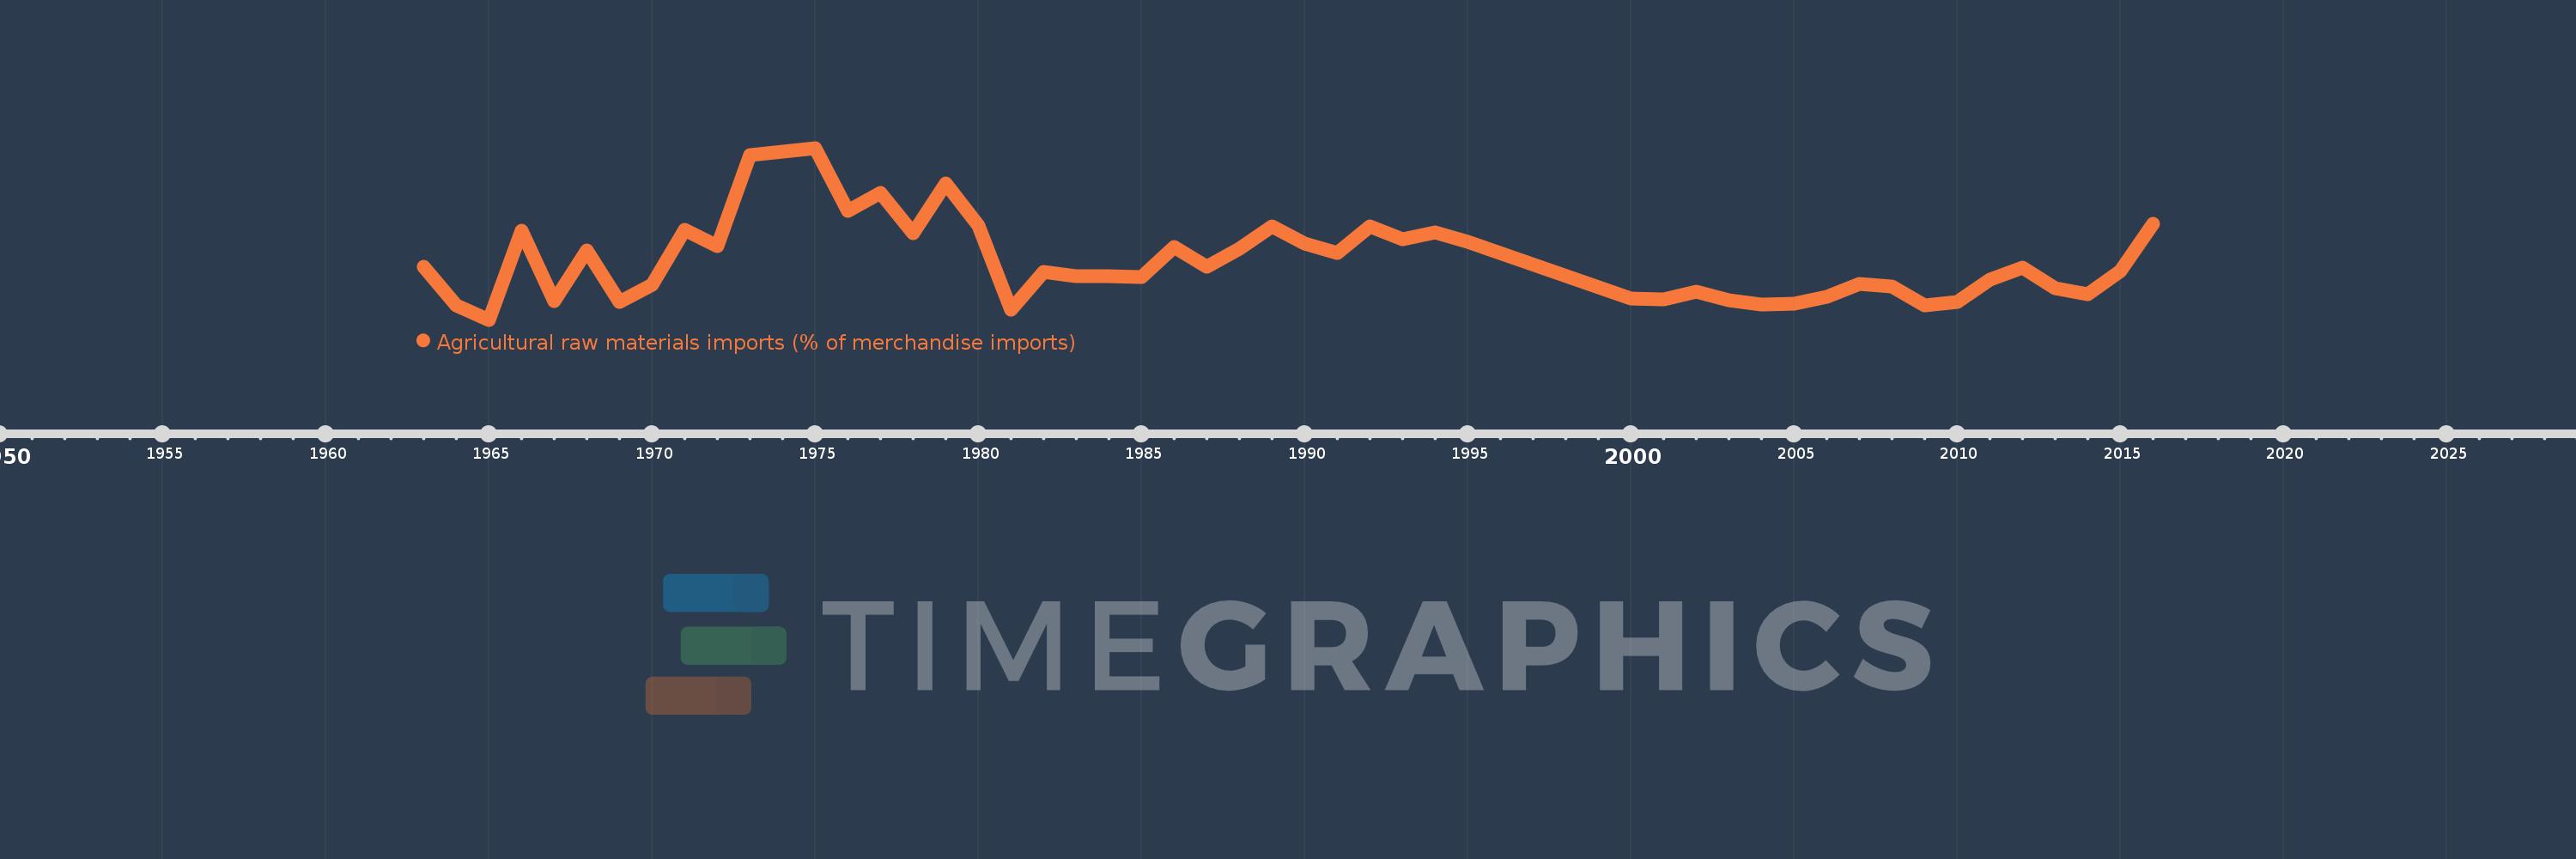
Agricultural raw materials imports (% of merchandise imports)
2016,2015,2014,2013,2012,2011,2010,2009,2008,2007,2006,2005,2004,2003,2002,2001,2000,1995,1994,1993,1992,1991,1990,1989,1988,1987,1986,1985,1984,1983,1982,1981,1980,1979,1978,1977,1976,1975,1973,1972,1971,1970,1969,1968,1967,1966,1965,1964,1963
This statistics in other country:
AfghanistanAlbaniaAlgeriaAndorraAngolaAntigua and BarbudaArab WorldArgentinaArmeniaArubaAustraliaAustriaAzerbaijanBahamas, TheBahrainBangladeshBarbadosBelarusBelgiumBelizeBeninBermudaBhutanBoliviaBosnia and HerzegovinaBotswanaBrazilBrunei DarussalamBulgariaBurkina FasoBurundiCabo VerdeCambodiaCameroonCanadaCaribbean small statesCayman IslandsCentral African RepublicCentral Europe and the BalticsChadChileChinaColombiaComorosCongo, Dem. Rep.Congo, Rep.Costa RicaCote d'IvoireCroatiaCubaCyprusCzech RepublicDenmarkDjiboutiDominicaDominican RepublicEarly-demographic dividendEast Asia & PacificEast Asia & Pacific (excluding high income)East Asia & Pacific (IDA & IBRD countries)EcuadorEgypt, Arab Rep.El SalvadorEquatorial GuineaEritreaEstoniaEthiopiaEuro areaEurope & Central AsiaEurope & Central Asia (excluding high income)Europe & Central Asia (IDA & IBRD countries)European UnionFaroe IslandsFijiFinlandFragile and conflict affected situationsFranceFrench PolynesiaGabonGambia, TheGeorgiaGermanyGhanaGreeceGreenlandGrenadaGuatemalaGuineaGuinea-BissauGuyanaHaitiHeavily indebted poor countries (HIPC)High incomeHondurasHong Kong SAR, ChinaHungaryIBRD onlyIcelandIDA & IBRD totalIDA blendIDA onlyIDA totalIndiaIndonesiaIran, Islamic Rep.IraqIrelandIsraelItalyJamaicaJapanJordanKazakhstanKenyaKiribatiKorea, Rep.KuwaitKyrgyz RepublicLao PDRLate-demographic dividendLatin America & Caribbean Latin America & Caribbean (excluding high income)Latin America & the Caribbean (IDA & IBRD countries)LatviaLeast developed countries: UN classificationLebanonLesothoLiberiaLibyaLithuaniaLow & middle incomeLow incomeLower middle incomeLuxembourgMacao SAR, ChinaMacedonia, FYRMadagascarMalawiMalaysiaMaldivesMaliMaltaMauritaniaMauritiusMexicoMiddle East & North AfricaMiddle East & North Africa (excluding high income)Middle East & North Africa (IDA & IBRD countries)Middle incomeMoldovaMongoliaMoroccoMozambiqueMyanmarNamibiaNepalNetherlandsNew CaledoniaNew ZealandNicaraguaNigerNigeriaNorth AmericaNorwayOECD membersOmanOther small statesPacific island small statesPakistanPalauPanamaPapua New GuineaParaguayPeruPhilippinesPolandPortugalPost-demographic dividendPre-demographic dividendQatarRomaniaRussian FederationRwandaSamoaSao Tome and PrincipeSaudi ArabiaSenegalSerbiaSeychellesSierra LeoneSingaporeSlovak RepublicSloveniaSmall statesSolomon IslandsSomaliaSouth AfricaSouth AsiaSouth Asia (IDA & IBRD)SpainSri LankaSt. Kitts and NevisSt. LuciaSt. Vincent and the GrenadinesSub-Saharan Africa Sub-Saharan Africa (excluding high income)Sub-Saharan Africa (IDA & IBRD countries)SudanSurinameSwazilandSwedenSwitzerlandSyrian Arab RepublicTajikistanTanzaniaThailandTimor-LesteTogoTongaTrinidad and TobagoTunisiaTurkeyTurkmenistanTurks and Caicos IslandsTuvaluUgandaUkraineUnited Arab EmiratesUnited KingdomUnited StatesUpper middle incomeUruguayVanuatuVenezuela, RBVietnamVirgin Islands (U.S.)WorldYemen, Rep.ZambiaZimbabwe Timeline:
This timeline shows a graph from 1963 to 2016 of Sri Lanka. No data until 1962. Number of actual observations by date: 49.
Source name:
World Development Indicators
Source organization:
World Bank staff estimates from the Comtrade database maintained by the United Nations Statistics Division.
Categories, topics:
Agriculture & Rural Development, Private Sector, Trade
Last updated:
apr 23, 2017
Indicators value changes by year
At the date of observation
Value
Absolute change
Change from previous value
jan 1, 1963
1.627
+1.627
0.0%
jan 1, 1964
1.114
-0.512
-31.51%
jan 1, 1965
0.928
-0.186
-16.74%
jan 1, 1966
2.1
+1.172
126.36%
jan 1, 1967
1.171
-0.928
-44.22%
jan 1, 1968
1.839
+0.667
56.98%
jan 1, 1969
1.158
-0.681
-37.05%
jan 1, 1970
1.381
+0.223
19.27%
jan 1, 1971
2.107
+0.727
52.66%
jan 1, 1972
1.89
-0.218
-10.32%
jan 1, 1973
3.09
+1.201
63.52%
jan 1, 1975
3.181
+0.091
2.94%
jan 1, 1976
2.356
-0.826
-25.96%
jan 1, 1977
2.597
+0.242
10.26%
jan 1, 1978
2.065
-0.533
-20.51%
jan 1, 1979
2.716
+0.652
31.56%
jan 1, 1980
2.159
-0.558
-20.53%
jan 1, 1981
1.064
-1.095
-50.73%
jan 1, 1982
1.554
+0.491
46.16%
jan 1, 1983
1.497
-0.057
-3.68%
jan 1, 1984
1.504
+0.007
0.48%
jan 1, 1985
1.488
-0.017
-1.1%
jan 1, 1986
1.879
+0.391
26.3%
jan 1, 1987
1.621
-0.258
-13.73%
jan 1, 1988
1.857
+0.236
14.53%
jan 1, 1989
2.151
+0.294
15.82%
jan 1, 1990
1.927
-0.223
-10.39%
jan 1, 1991
1.805
-0.123
-6.36%
jan 1, 1992
2.157
+0.353
19.56%
jan 1, 1993
1.988
-0.169
-7.86%
jan 1, 1994
2.071
+0.083
4.18%
jan 1, 1995
1.95
-0.121
-5.85%
jan 1, 2000
1.201
-0.749
-38.41%
jan 1, 2001
1.196
-0.005
-0.41%
jan 1, 2002
1.298
+0.102
8.51%
jan 1, 2003
1.18
-0.118
-9.06%
jan 1, 2004
1.126
-0.054
-4.58%
jan 1, 2005
1.137
+0.011
0.99%
jan 1, 2006
1.224
+0.087
7.62%
jan 1, 2007
1.394
+0.169
13.84%
jan 1, 2008
1.362
-0.031
-2.25%
jan 1, 2009
1.111
-0.251
-18.41%
jan 1, 2010
1.159
+0.048
4.32%
jan 1, 2011
1.453
+0.293
25.31%
jan 1, 2012
1.612
+0.159
10.94%
jan 1, 2013
1.343
-0.269
-16.68%
jan 1, 2014
1.26
-0.083
-6.15%
jan 1, 2015
1.563
+0.303
24.02%
jan 1, 2016
2.186
+0.623
39.87%
Ranking of countries by current statistics by years


Comments: