29
/
en
AIzaSyAYiBZKx7MnpbEhh9jyipgxe19OcubqV5w
April 1, 2024
83711
Benin
BEN
true
2
1
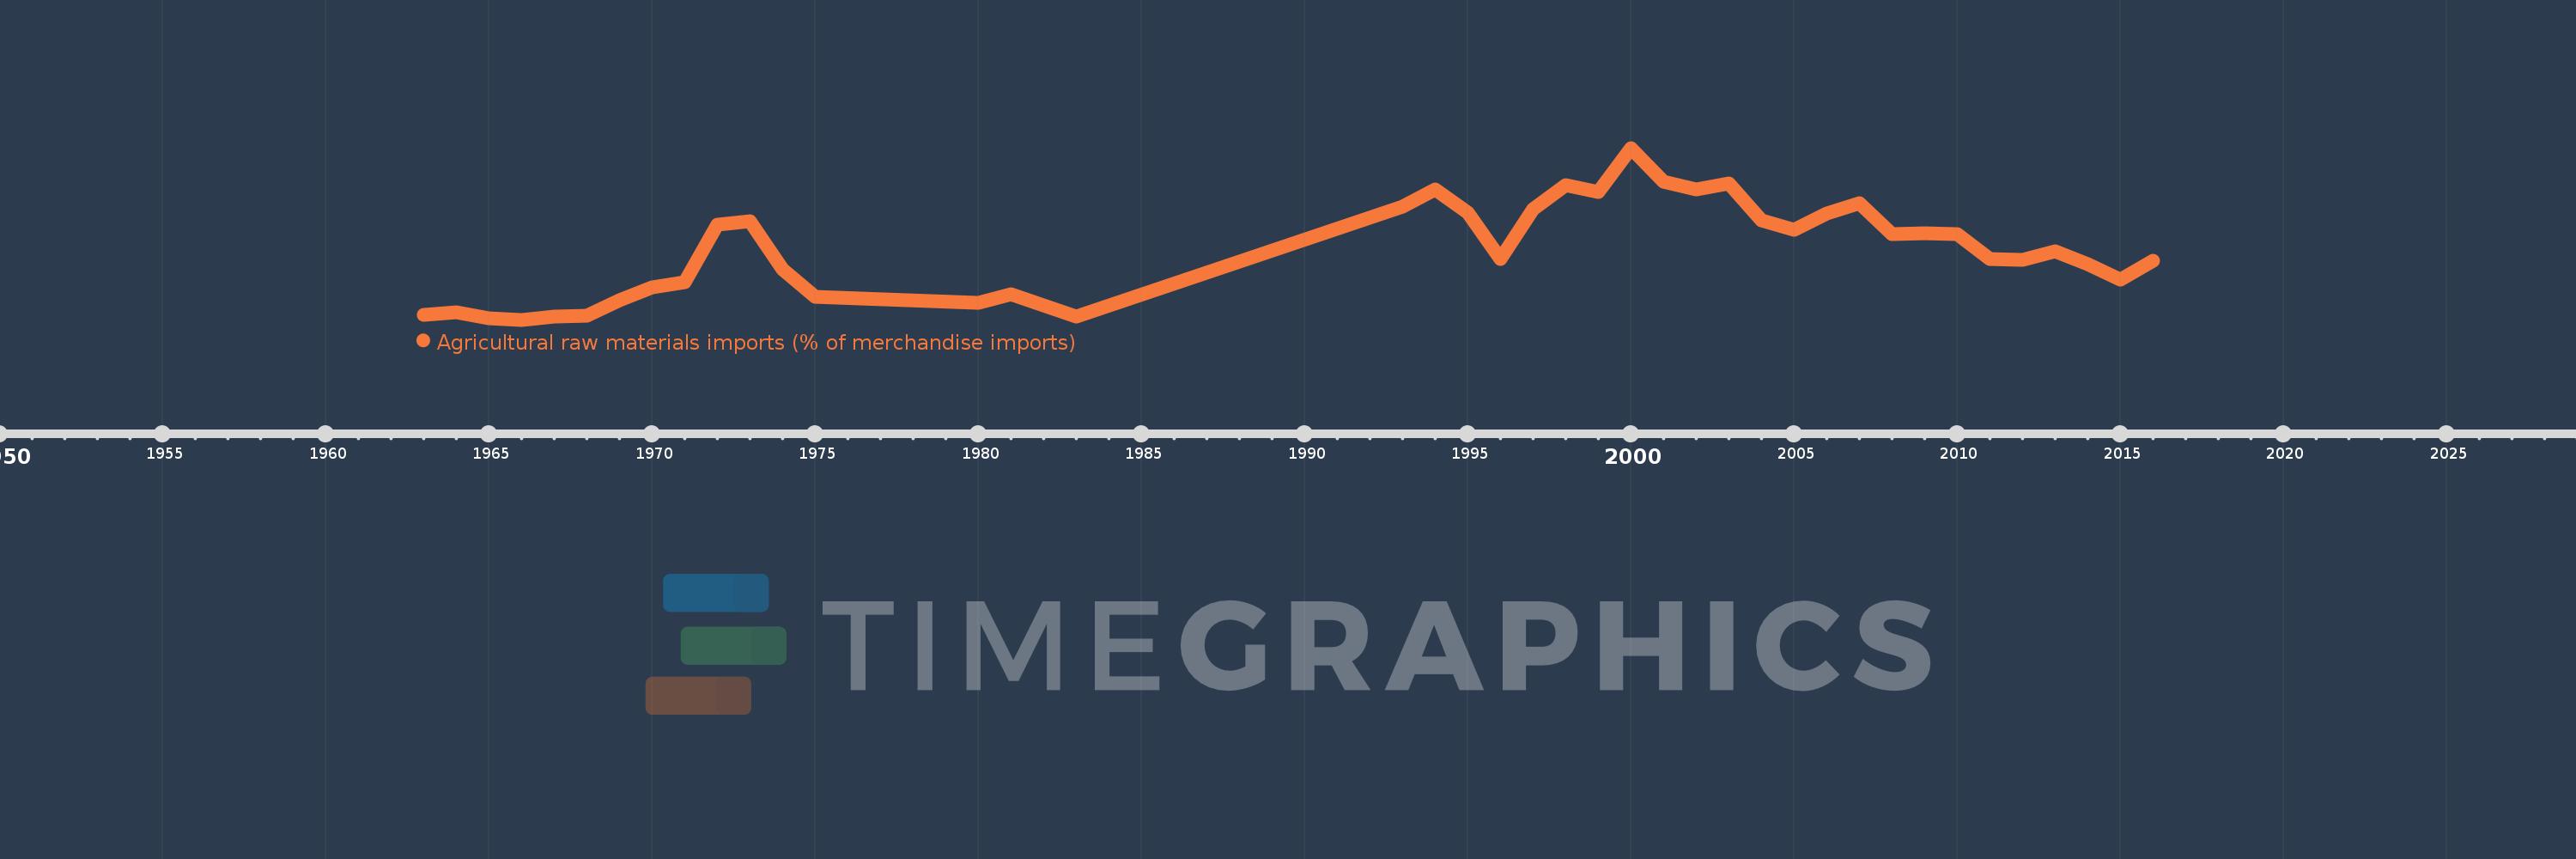
Agricultural raw materials imports (% of merchandise imports)
2016,2015,2014,2013,2012,2011,2010,2009,2008,2007,2006,2005,2004,2003,2002,2001,2000,1999,1998,1997,1996,1995,1994,1993,1983,1981,1980,1975,1974,1973,1972,1971,1970,1969,1968,1967,1966,1965,1964,1963
This statistics in other country:
AfghanistanAlbaniaAlgeriaAndorraAngolaAntigua and BarbudaArab WorldArgentinaArmeniaArubaAustraliaAustriaAzerbaijanBahamas, TheBahrainBangladeshBarbadosBelarusBelgiumBelizeBeninBermudaBhutanBoliviaBosnia and HerzegovinaBotswanaBrazilBrunei DarussalamBulgariaBurkina FasoBurundiCabo VerdeCambodiaCameroonCanadaCaribbean small statesCayman IslandsCentral African RepublicCentral Europe and the BalticsChadChileChinaColombiaComorosCongo, Dem. Rep.Congo, Rep.Costa RicaCote d'IvoireCroatiaCubaCyprusCzech RepublicDenmarkDjiboutiDominicaDominican RepublicEarly-demographic dividendEast Asia & PacificEast Asia & Pacific (excluding high income)East Asia & Pacific (IDA & IBRD countries)EcuadorEgypt, Arab Rep.El SalvadorEquatorial GuineaEritreaEstoniaEthiopiaEuro areaEurope & Central AsiaEurope & Central Asia (excluding high income)Europe & Central Asia (IDA & IBRD countries)European UnionFaroe IslandsFijiFinlandFragile and conflict affected situationsFranceFrench PolynesiaGabonGambia, TheGeorgiaGermanyGhanaGreeceGreenlandGrenadaGuatemalaGuineaGuinea-BissauGuyanaHaitiHeavily indebted poor countries (HIPC)High incomeHondurasHong Kong SAR, ChinaHungaryIBRD onlyIcelandIDA & IBRD totalIDA blendIDA onlyIDA totalIndiaIndonesiaIran, Islamic Rep.IraqIrelandIsraelItalyJamaicaJapanJordanKazakhstanKenyaKiribatiKorea, Rep.KuwaitKyrgyz RepublicLao PDRLate-demographic dividendLatin America & Caribbean Latin America & Caribbean (excluding high income)Latin America & the Caribbean (IDA & IBRD countries)LatviaLeast developed countries: UN classificationLebanonLesothoLiberiaLibyaLithuaniaLow & middle incomeLow incomeLower middle incomeLuxembourgMacao SAR, ChinaMacedonia, FYRMadagascarMalawiMalaysiaMaldivesMaliMaltaMauritaniaMauritiusMexicoMiddle East & North AfricaMiddle East & North Africa (excluding high income)Middle East & North Africa (IDA & IBRD countries)Middle incomeMoldovaMongoliaMoroccoMozambiqueMyanmarNamibiaNepalNetherlandsNew CaledoniaNew ZealandNicaraguaNigerNigeriaNorth AmericaNorwayOECD membersOmanOther small statesPacific island small statesPakistanPalauPanamaPapua New GuineaParaguayPeruPhilippinesPolandPortugalPost-demographic dividendPre-demographic dividendQatarRomaniaRussian FederationRwandaSamoaSao Tome and PrincipeSaudi ArabiaSenegalSerbiaSeychellesSierra LeoneSingaporeSlovak RepublicSloveniaSmall statesSolomon IslandsSomaliaSouth AfricaSouth AsiaSouth Asia (IDA & IBRD)SpainSri LankaSt. Kitts and NevisSt. LuciaSt. Vincent and the GrenadinesSub-Saharan Africa Sub-Saharan Africa (excluding high income)Sub-Saharan Africa (IDA & IBRD countries)SudanSurinameSwazilandSwedenSwitzerlandSyrian Arab RepublicTajikistanTanzaniaThailandTimor-LesteTogoTongaTrinidad and TobagoTunisiaTurkeyTurkmenistanTurks and Caicos IslandsTuvaluUgandaUkraineUnited Arab EmiratesUnited KingdomUnited StatesUpper middle incomeUruguayVanuatuVenezuela, RBVietnamVirgin Islands (U.S.)WorldYemen, Rep.ZambiaZimbabwe Timeline:
This timeline shows a graph from 1963 to 2016 of Benin. No data until 1962. Number of actual observations by date: 40.
Source name:
World Development Indicators
Source organization:
World Bank staff estimates from the Comtrade database maintained by the United Nations Statistics Division.
Categories, topics:
Agriculture & Rural Development, Private Sector, Trade
Last updated:
apr 23, 2017
Indicators value changes by year
At the date of observation
Value
Absolute change
Change from previous value
jan 1, 1963
0.684
+0.684
0.0%
jan 1, 1964
0.778
+0.095
13.85%
jan 1, 1965
0.572
-0.206
-26.46%
jan 1, 1966
0.518
-0.054
-9.51%
jan 1, 1967
0.615
+0.097
18.72%
jan 1, 1968
0.668
+0.053
8.62%
jan 1, 1969
1.204
+0.536
80.22%
jan 1, 1970
1.652
+0.448
37.25%
jan 1, 1971
1.823
+0.171
10.35%
jan 1, 1972
3.848
+2.025
111.05%
jan 1, 1973
3.979
+0.131
3.41%
jan 1, 1974
2.277
-1.702
-42.78%
jan 1, 1975
1.322
-0.955
-41.94%
jan 1, 1980
1.111
-0.211
-15.98%
jan 1, 1981
1.4
+0.289
26.06%
jan 1, 1983
0.643
-0.757
-54.05%
jan 1, 1993
4.482
+3.838
596.49%
jan 1, 1994
5.089
+0.607
13.55%
jan 1, 1995
4.271
-0.818
-16.07%
jan 1, 1996
2.65
-1.621
-37.95%
jan 1, 1997
4.4
+1.75
66.04%
jan 1, 1998
5.239
+0.839
19.06%
jan 1, 1999
4.979
-0.26
-4.97%
jan 1, 2000
6.528
+1.549
31.12%
jan 1, 2001
5.341
-1.186
-18.18%
jan 1, 2002
5.076
-0.266
-4.97%
jan 1, 2003
5.29
+0.214
4.22%
jan 1, 2004
3.98
-1.31
-24.76%
jan 1, 2005
3.665
-0.315
-7.92%
jan 1, 2006
4.223
+0.559
15.24%
jan 1, 2007
4.592
+0.369
8.74%
jan 1, 2008
3.51
-1.083
-23.58%
jan 1, 2009
3.555
+0.046
1.3%
jan 1, 2010
3.521
-0.034
-0.96%
jan 1, 2011
2.636
-0.886
-25.15%
jan 1, 2012
2.621
-0.015
-0.56%
jan 1, 2013
2.915
+0.294
11.2%
jan 1, 2014
2.463
-0.452
-15.49%
jan 1, 2015
1.932
-0.531
-21.58%
jan 1, 2016
2.578
+0.646
33.46%
Ranking of countries by current statistics by years


Comments: