29
/
en
AIzaSyAYiBZKx7MnpbEhh9jyipgxe19OcubqV5w
April 1, 2024
191141
Malta
MLT
true
2
1
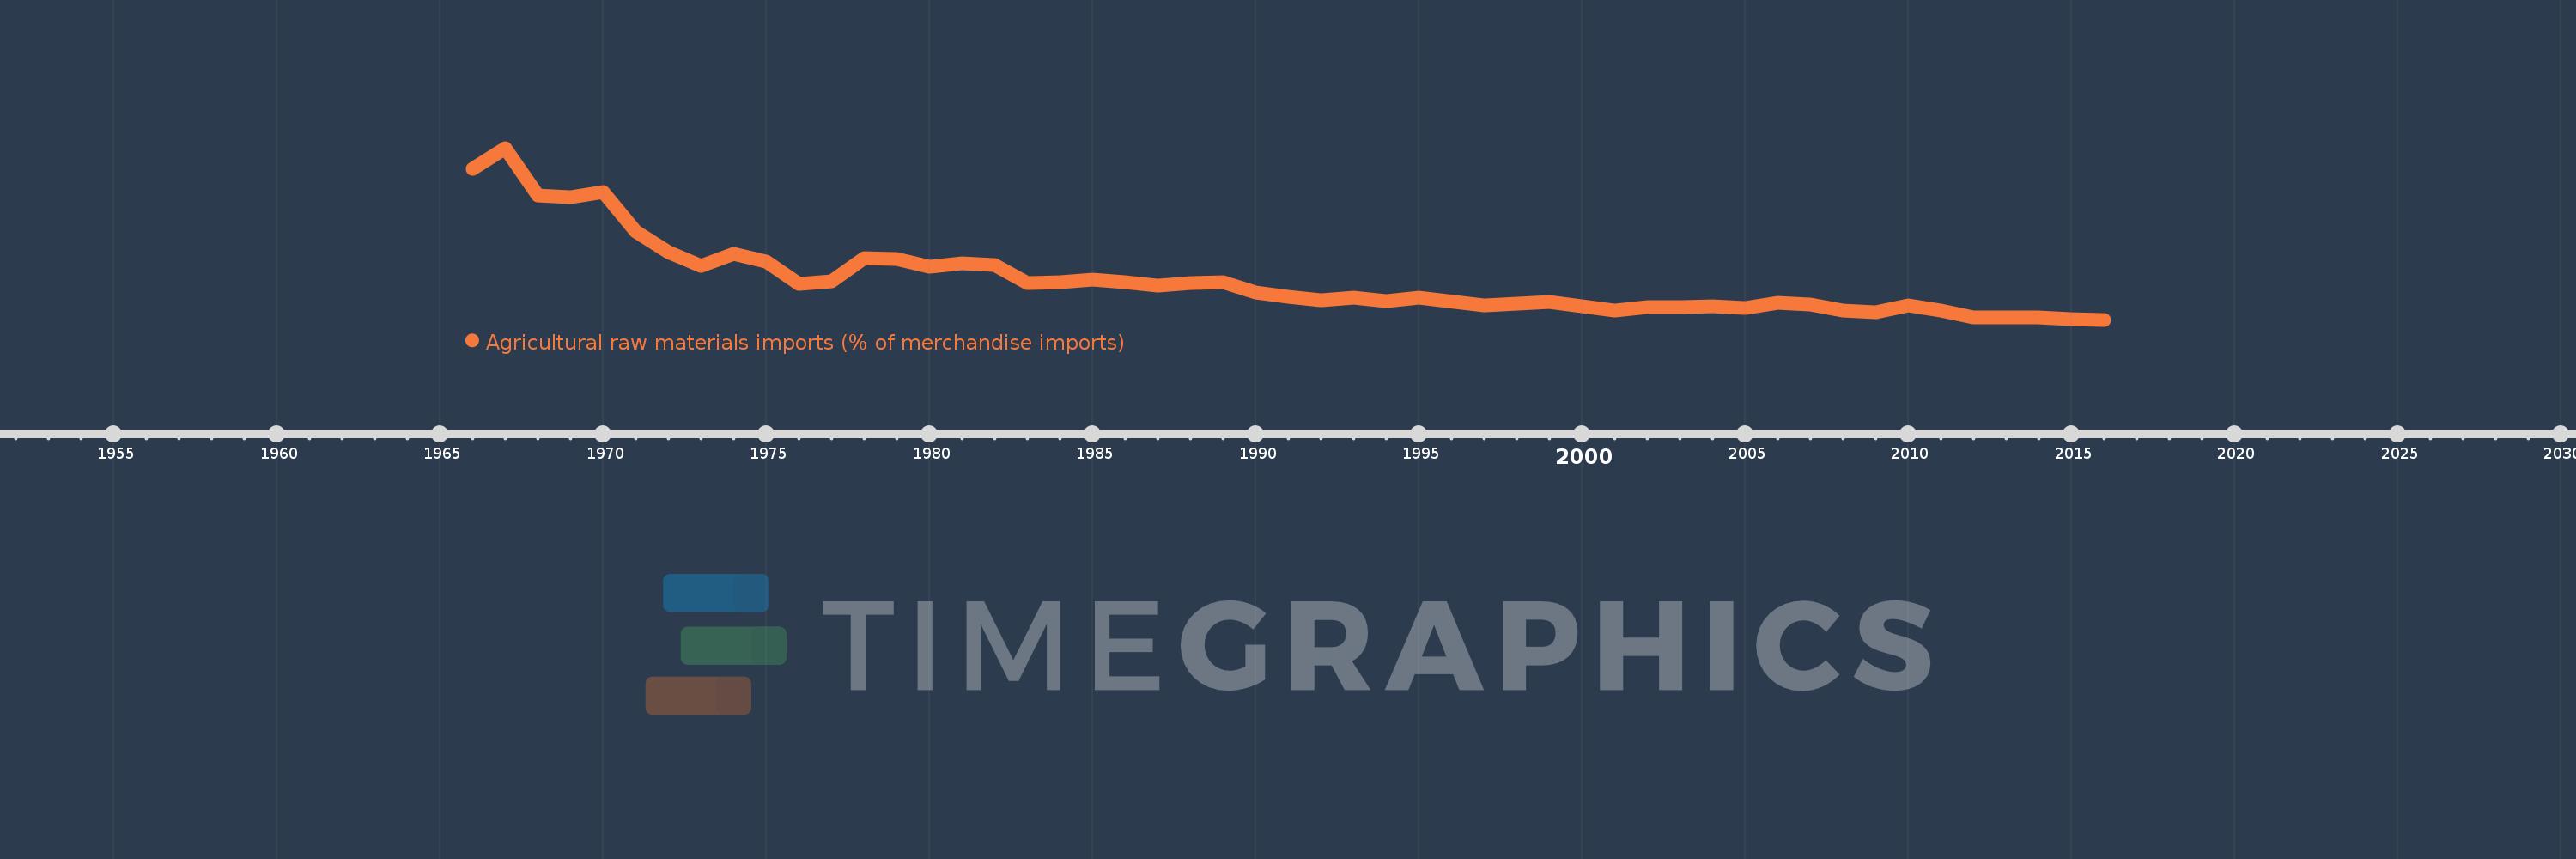
Agricultural raw materials imports (% of merchandise imports)
2016,2015,2014,2013,2012,2011,2010,2009,2008,2007,2006,2005,2004,2003,2002,2001,2000,1999,1998,1997,1995,1994,1993,1992,1991,1990,1989,1988,1987,1986,1985,1984,1983,1982,1981,1980,1979,1978,1977,1976,1975,1974,1973,1972,1971,1970,1969,1968,1967,1966
This statistics in other country:
AfghanistanAlbaniaAlgeriaAndorraAngolaAntigua and BarbudaArab WorldArgentinaArmeniaArubaAustraliaAustriaAzerbaijanBahamas, TheBahrainBangladeshBarbadosBelarusBelgiumBelizeBeninBermudaBhutanBoliviaBosnia and HerzegovinaBotswanaBrazilBrunei DarussalamBulgariaBurkina FasoBurundiCabo VerdeCambodiaCameroonCanadaCaribbean small statesCayman IslandsCentral African RepublicCentral Europe and the BalticsChadChileChinaColombiaComorosCongo, Dem. Rep.Congo, Rep.Costa RicaCote d'IvoireCroatiaCubaCyprusCzech RepublicDenmarkDjiboutiDominicaDominican RepublicEarly-demographic dividendEast Asia & PacificEast Asia & Pacific (excluding high income)East Asia & Pacific (IDA & IBRD countries)EcuadorEgypt, Arab Rep.El SalvadorEquatorial GuineaEritreaEstoniaEthiopiaEuro areaEurope & Central AsiaEurope & Central Asia (excluding high income)Europe & Central Asia (IDA & IBRD countries)European UnionFaroe IslandsFijiFinlandFragile and conflict affected situationsFranceFrench PolynesiaGabonGambia, TheGeorgiaGermanyGhanaGreeceGreenlandGrenadaGuatemalaGuineaGuinea-BissauGuyanaHaitiHeavily indebted poor countries (HIPC)High incomeHondurasHong Kong SAR, ChinaHungaryIBRD onlyIcelandIDA & IBRD totalIDA blendIDA onlyIDA totalIndiaIndonesiaIran, Islamic Rep.IraqIrelandIsraelItalyJamaicaJapanJordanKazakhstanKenyaKiribatiKorea, Rep.KuwaitKyrgyz RepublicLao PDRLate-demographic dividendLatin America & Caribbean Latin America & Caribbean (excluding high income)Latin America & the Caribbean (IDA & IBRD countries)LatviaLeast developed countries: UN classificationLebanonLesothoLiberiaLibyaLithuaniaLow & middle incomeLow incomeLower middle incomeLuxembourgMacao SAR, ChinaMacedonia, FYRMadagascarMalawiMalaysiaMaldivesMaliMaltaMauritaniaMauritiusMexicoMiddle East & North AfricaMiddle East & North Africa (excluding high income)Middle East & North Africa (IDA & IBRD countries)Middle incomeMoldovaMongoliaMoroccoMozambiqueMyanmarNamibiaNepalNetherlandsNew CaledoniaNew ZealandNicaraguaNigerNigeriaNorth AmericaNorwayOECD membersOmanOther small statesPacific island small statesPakistanPalauPanamaPapua New GuineaParaguayPeruPhilippinesPolandPortugalPost-demographic dividendPre-demographic dividendQatarRomaniaRussian FederationRwandaSamoaSao Tome and PrincipeSaudi ArabiaSenegalSerbiaSeychellesSierra LeoneSingaporeSlovak RepublicSloveniaSmall statesSolomon IslandsSomaliaSouth AfricaSouth AsiaSouth Asia (IDA & IBRD)SpainSri LankaSt. Kitts and NevisSt. LuciaSt. Vincent and the GrenadinesSub-Saharan Africa Sub-Saharan Africa (excluding high income)Sub-Saharan Africa (IDA & IBRD countries)SudanSurinameSwazilandSwedenSwitzerlandSyrian Arab RepublicTajikistanTanzaniaThailandTimor-LesteTogoTongaTrinidad and TobagoTunisiaTurkeyTurkmenistanTurks and Caicos IslandsTuvaluUgandaUkraineUnited Arab EmiratesUnited KingdomUnited StatesUpper middle incomeUruguayVanuatuVenezuela, RBVietnamVirgin Islands (U.S.)WorldYemen, Rep.ZambiaZimbabwe Timeline:
This timeline shows a graph from 1966 to 2016 of Malta. No data until 1965. Number of actual observations by date: 50.
Source name:
World Development Indicators
Source organization:
World Bank staff estimates from the Comtrade database maintained by the United Nations Statistics Division.
Categories, topics:
Agriculture & Rural Development, Private Sector, Trade
Last updated:
apr 23, 2017
Indicators value changes by year
At the date of observation
Value
Absolute change
Change from previous value
jan 1, 1966
5.18
+5.18
0.0%
jan 1, 1967
5.879
+0.699
13.5%
jan 1, 1968
4.33
-1.549
-26.35%
jan 1, 1969
4.26
-0.07
-1.61%
jan 1, 1970
4.433
+0.173
4.06%
jan 1, 1971
3.143
-1.29
-29.1%
jan 1, 1972
2.443
-0.7
-22.28%
jan 1, 1973
1.999
-0.444
-18.18%
jan 1, 1974
2.4
+0.402
20.1%
jan 1, 1975
2.15
-0.25
-10.43%
jan 1, 1976
1.41
-0.74
-34.42%
jan 1, 1977
1.503
+0.093
6.6%
jan 1, 1978
2.246
+0.743
49.4%
jan 1, 1979
2.234
-0.011
-0.51%
jan 1, 1980
1.984
-0.25
-11.18%
jan 1, 1981
2.091
+0.107
5.37%
jan 1, 1982
2.038
-0.052
-2.51%
jan 1, 1983
1.44
-0.598
-29.35%
jan 1, 1984
1.475
+0.035
2.43%
jan 1, 1985
1.543
+0.068
4.62%
jan 1, 1986
1.469
-0.074
-4.81%
jan 1, 1987
1.362
-0.107
-7.29%
jan 1, 1988
1.435
+0.073
5.35%
jan 1, 1989
1.46
+0.025
1.73%
jan 1, 1990
1.115
-0.345
-23.61%
jan 1, 1991
0.979
-0.136
-12.17%
jan 1, 1992
0.881
-0.098
-10.04%
jan 1, 1993
0.963
+0.082
9.27%
jan 1, 1994
0.857
-0.105
-10.95%
jan 1, 1995
0.947
+0.09
10.52%
jan 1, 1997
0.691
-0.257
-27.1%
jan 1, 1998
0.747
+0.056
8.15%
jan 1, 1999
0.811
+0.064
8.63%
jan 1, 2000
0.681
-0.13
-16.02%
jan 1, 2001
0.529
-0.153
-22.39%
jan 1, 2002
0.66
+0.131
24.74%
jan 1, 2003
0.65
-0.01
-1.49%
jan 1, 2004
0.669
+0.019
2.89%
jan 1, 2005
0.61
-0.059
-8.82%
jan 1, 2006
0.781
+0.171
28.03%
jan 1, 2007
0.734
-0.047
-5.96%
jan 1, 2008
0.526
-0.208
-28.3%
jan 1, 2009
0.487
-0.04
-7.56%
jan 1, 2010
0.714
+0.228
46.82%
jan 1, 2011
0.53
-0.185
-25.84%
jan 1, 2012
0.301
-0.229
-43.2%
jan 1, 2013
0.3
-0.001
-0.38%
jan 1, 2014
0.314
+0.014
4.83%
jan 1, 2015
0.245
-0.069
-21.99%
jan 1, 2016
0.233
-0.012
-4.78%
Ranking of countries by current statistics by years


Comments: