29
/
en
AIzaSyAYiBZKx7MnpbEhh9jyipgxe19OcubqV5w
April 1, 2024
134766
French Polynesia
PYF
true
2
1
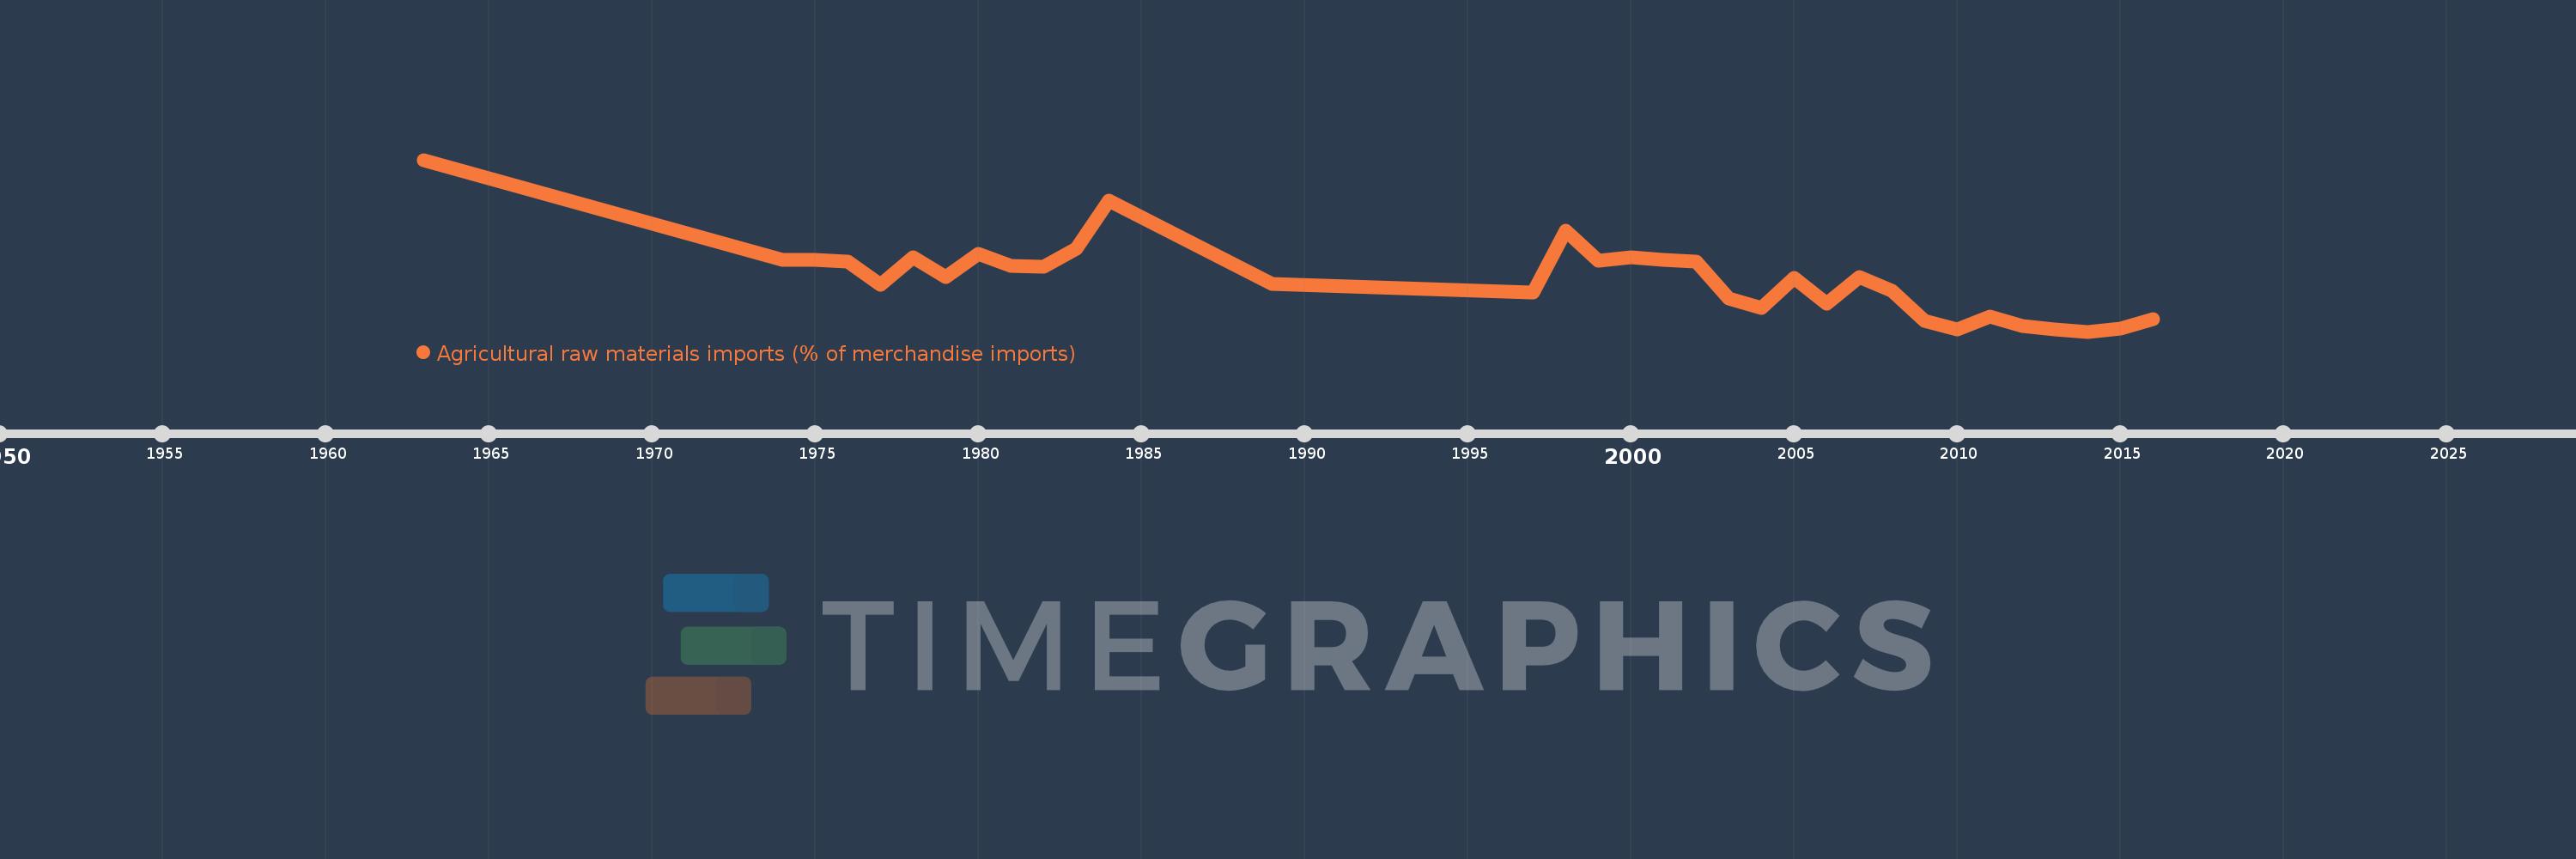
Agricultural raw materials imports (% of merchandise imports)
2016,2015,2014,2013,2012,2011,2010,2009,2008,2007,2006,2005,2004,2003,2002,2001,2000,1999,1998,1997,1989,1984,1983,1982,1981,1980,1979,1978,1977,1976,1975,1974,1963
This statistics in other country:
AfghanistanAlbaniaAlgeriaAndorraAngolaAntigua and BarbudaArab WorldArgentinaArmeniaArubaAustraliaAustriaAzerbaijanBahamas, TheBahrainBangladeshBarbadosBelarusBelgiumBelizeBeninBermudaBhutanBoliviaBosnia and HerzegovinaBotswanaBrazilBrunei DarussalamBulgariaBurkina FasoBurundiCabo VerdeCambodiaCameroonCanadaCaribbean small statesCayman IslandsCentral African RepublicCentral Europe and the BalticsChadChileChinaColombiaComorosCongo, Dem. Rep.Congo, Rep.Costa RicaCote d'IvoireCroatiaCubaCyprusCzech RepublicDenmarkDjiboutiDominicaDominican RepublicEarly-demographic dividendEast Asia & PacificEast Asia & Pacific (excluding high income)East Asia & Pacific (IDA & IBRD countries)EcuadorEgypt, Arab Rep.El SalvadorEquatorial GuineaEritreaEstoniaEthiopiaEuro areaEurope & Central AsiaEurope & Central Asia (excluding high income)Europe & Central Asia (IDA & IBRD countries)European UnionFaroe IslandsFijiFinlandFragile and conflict affected situationsFranceFrench PolynesiaGabonGambia, TheGeorgiaGermanyGhanaGreeceGreenlandGrenadaGuatemalaGuineaGuinea-BissauGuyanaHaitiHeavily indebted poor countries (HIPC)High incomeHondurasHong Kong SAR, ChinaHungaryIBRD onlyIcelandIDA & IBRD totalIDA blendIDA onlyIDA totalIndiaIndonesiaIran, Islamic Rep.IraqIrelandIsraelItalyJamaicaJapanJordanKazakhstanKenyaKiribatiKorea, Rep.KuwaitKyrgyz RepublicLao PDRLate-demographic dividendLatin America & Caribbean Latin America & Caribbean (excluding high income)Latin America & the Caribbean (IDA & IBRD countries)LatviaLeast developed countries: UN classificationLebanonLesothoLiberiaLibyaLithuaniaLow & middle incomeLow incomeLower middle incomeLuxembourgMacao SAR, ChinaMacedonia, FYRMadagascarMalawiMalaysiaMaldivesMaliMaltaMauritaniaMauritiusMexicoMiddle East & North AfricaMiddle East & North Africa (excluding high income)Middle East & North Africa (IDA & IBRD countries)Middle incomeMoldovaMongoliaMoroccoMozambiqueMyanmarNamibiaNepalNetherlandsNew CaledoniaNew ZealandNicaraguaNigerNigeriaNorth AmericaNorwayOECD membersOmanOther small statesPacific island small statesPakistanPalauPanamaPapua New GuineaParaguayPeruPhilippinesPolandPortugalPost-demographic dividendPre-demographic dividendQatarRomaniaRussian FederationRwandaSamoaSao Tome and PrincipeSaudi ArabiaSenegalSerbiaSeychellesSierra LeoneSingaporeSlovak RepublicSloveniaSmall statesSolomon IslandsSomaliaSouth AfricaSouth AsiaSouth Asia (IDA & IBRD)SpainSri LankaSt. Kitts and NevisSt. LuciaSt. Vincent and the GrenadinesSub-Saharan Africa Sub-Saharan Africa (excluding high income)Sub-Saharan Africa (IDA & IBRD countries)SudanSurinameSwazilandSwedenSwitzerlandSyrian Arab RepublicTajikistanTanzaniaThailandTimor-LesteTogoTongaTrinidad and TobagoTunisiaTurkeyTurkmenistanTurks and Caicos IslandsTuvaluUgandaUkraineUnited Arab EmiratesUnited KingdomUnited StatesUpper middle incomeUruguayVanuatuVenezuela, RBVietnamVirgin Islands (U.S.)WorldYemen, Rep.ZambiaZimbabwe Timeline:
This timeline shows a graph from 1963 to 2016 of French Polynesia. No data until 1962. Number of actual observations by date: 33.
Source name:
World Development Indicators
Source organization:
World Bank staff estimates from the Comtrade database maintained by the United Nations Statistics Division.
Categories, topics:
Agriculture & Rural Development, Private Sector, Trade
Last updated:
apr 23, 2017
Indicators value changes by year
At the date of observation
Value
Absolute change
Change from previous value
jan 1, 1963
3.047
+3.047
0.0%
jan 1, 1974
1.864
-1.183
-38.82%
jan 1, 1975
1.863
-0.001
-0.05%
jan 1, 1976
1.846
-0.017
-0.91%
jan 1, 1977
1.564
-0.283
-15.3%
jan 1, 1978
1.895
+0.331
21.14%
jan 1, 1979
1.662
-0.233
-12.27%
jan 1, 1980
1.933
+0.271
16.33%
jan 1, 1981
1.787
-0.147
-7.59%
jan 1, 1982
1.786
-0.001
-0.04%
jan 1, 1983
1.992
+0.206
11.54%
jan 1, 1984
2.569
+0.577
28.95%
jan 1, 1989
1.581
-0.988
-38.46%
jan 1, 1997
1.476
-0.105
-6.64%
jan 1, 1998
2.206
+0.73
49.47%
jan 1, 1999
1.854
-0.352
-15.97%
jan 1, 2000
1.894
+0.04
2.15%
jan 1, 2001
1.859
-0.035
-1.83%
jan 1, 2002
1.838
-0.021
-1.14%
jan 1, 2003
1.41
-0.428
-23.29%
jan 1, 2004
1.296
-0.114
-8.1%
jan 1, 2005
1.653
+0.358
27.61%
jan 1, 2006
1.348
-0.306
-18.49%
jan 1, 2007
1.655
+0.307
22.81%
jan 1, 2008
1.498
-0.157
-9.5%
jan 1, 2009
1.14
-0.358
-23.92%
jan 1, 2010
1.044
-0.095
-8.35%
jan 1, 2011
1.189
+0.145
13.86%
jan 1, 2012
1.075
-0.114
-9.61%
jan 1, 2013
1.043
-0.032
-3.01%
jan 1, 2014
1.014
-0.028
-2.71%
jan 1, 2015
1.051
+0.036
3.59%
jan 1, 2016
1.159
+0.108
10.31%
Ranking of countries by current statistics by years


Comments: