29
/
en
AIzaSyAYiBZKx7MnpbEhh9jyipgxe19OcubqV5w
April 1, 2024
179748
Libya
LBY
true
2
1
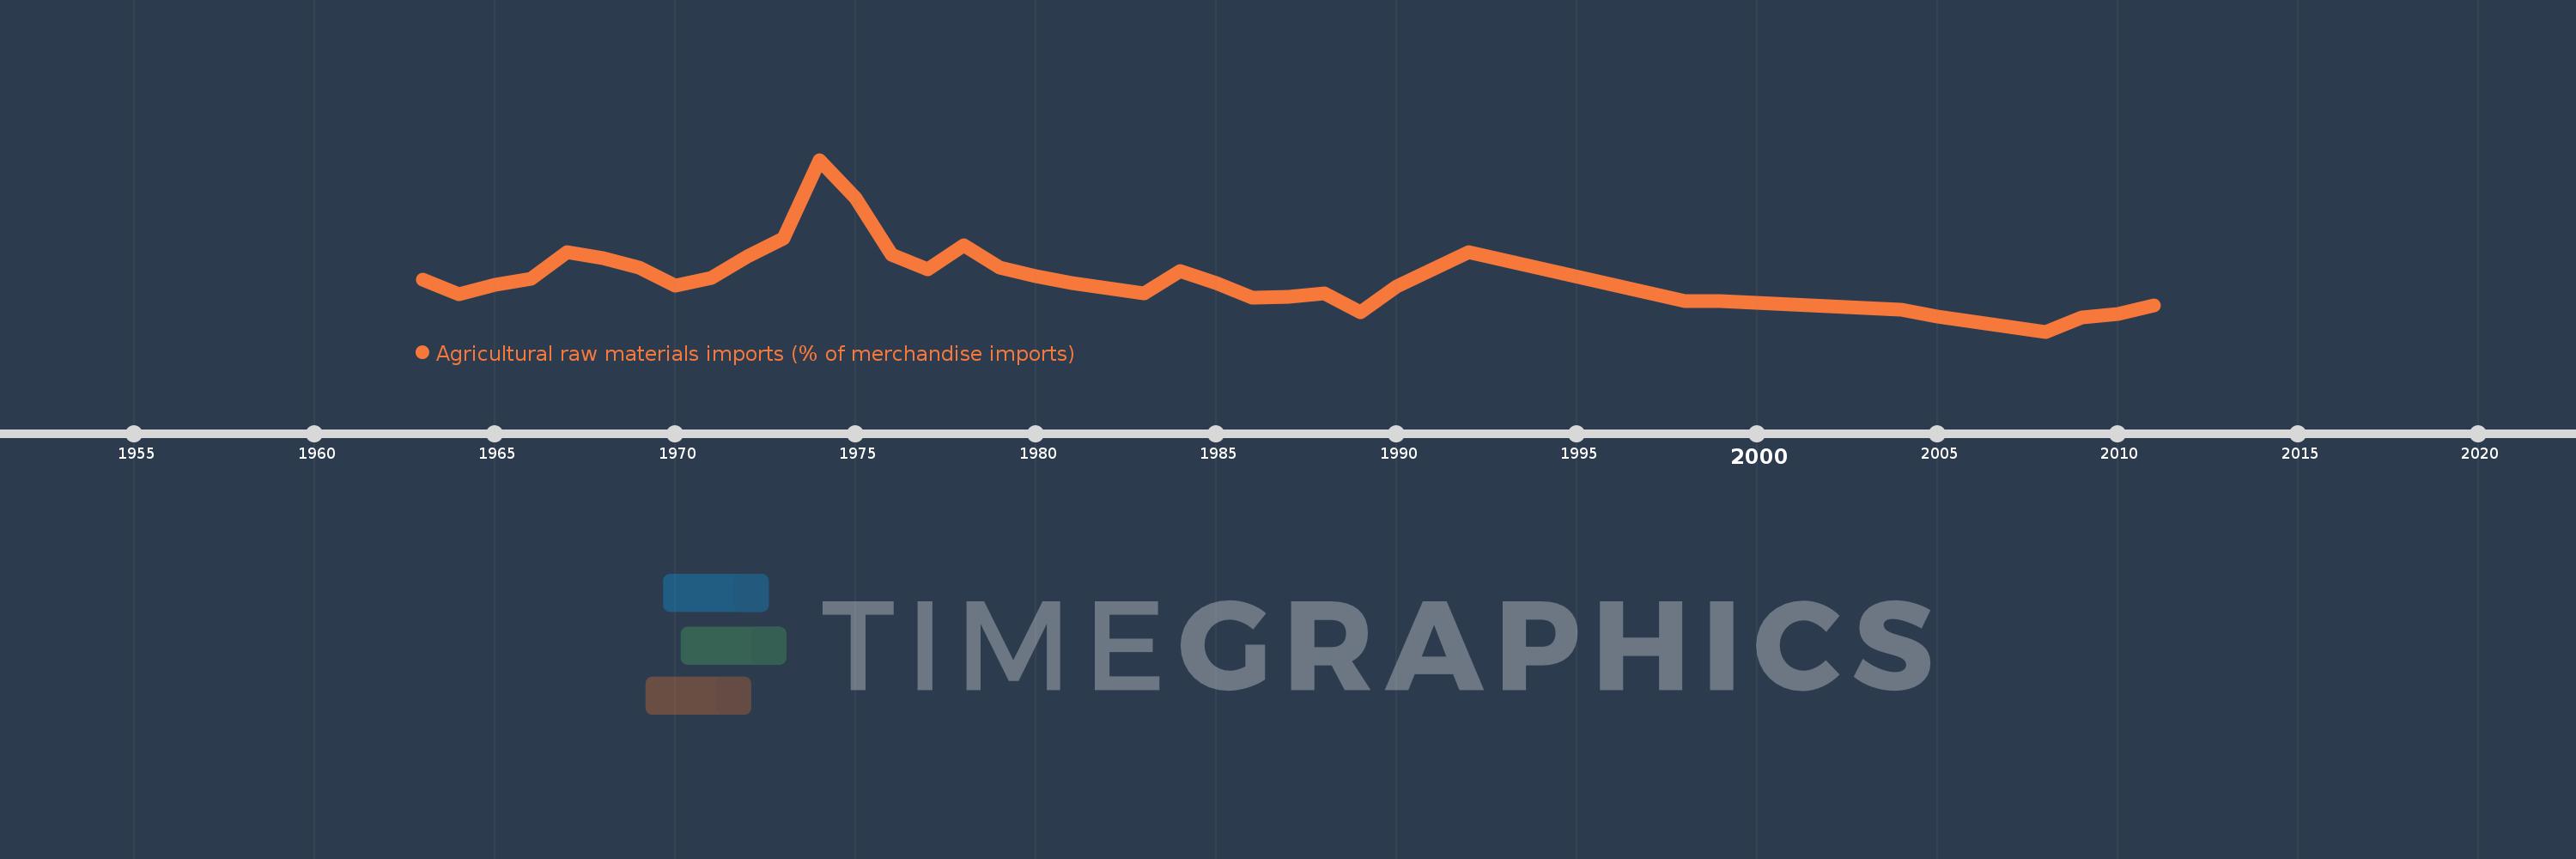
Agricultural raw materials imports (% of merchandise imports)
2011,2010,2009,2008,2005,2004,1999,1998,1992,1990,1989,1988,1987,1986,1985,1984,1983,1982,1981,1980,1979,1978,1977,1976,1975,1974,1973,1972,1971,1970,1969,1968,1967,1966,1965,1964,1963
This statistics in other country:
AfghanistanAlbaniaAlgeriaAndorraAngolaAntigua and BarbudaArab WorldArgentinaArmeniaArubaAustraliaAustriaAzerbaijanBahamas, TheBahrainBangladeshBarbadosBelarusBelgiumBelizeBeninBermudaBhutanBoliviaBosnia and HerzegovinaBotswanaBrazilBrunei DarussalamBulgariaBurkina FasoBurundiCabo VerdeCambodiaCameroonCanadaCaribbean small statesCayman IslandsCentral African RepublicCentral Europe and the BalticsChadChileChinaColombiaComorosCongo, Dem. Rep.Congo, Rep.Costa RicaCote d'IvoireCroatiaCubaCyprusCzech RepublicDenmarkDjiboutiDominicaDominican RepublicEarly-demographic dividendEast Asia & PacificEast Asia & Pacific (excluding high income)East Asia & Pacific (IDA & IBRD countries)EcuadorEgypt, Arab Rep.El SalvadorEquatorial GuineaEritreaEstoniaEthiopiaEuro areaEurope & Central AsiaEurope & Central Asia (excluding high income)Europe & Central Asia (IDA & IBRD countries)European UnionFaroe IslandsFijiFinlandFragile and conflict affected situationsFranceFrench PolynesiaGabonGambia, TheGeorgiaGermanyGhanaGreeceGreenlandGrenadaGuatemalaGuineaGuinea-BissauGuyanaHaitiHeavily indebted poor countries (HIPC)High incomeHondurasHong Kong SAR, ChinaHungaryIBRD onlyIcelandIDA & IBRD totalIDA blendIDA onlyIDA totalIndiaIndonesiaIran, Islamic Rep.IraqIrelandIsraelItalyJamaicaJapanJordanKazakhstanKenyaKiribatiKorea, Rep.KuwaitKyrgyz RepublicLao PDRLate-demographic dividendLatin America & Caribbean Latin America & Caribbean (excluding high income)Latin America & the Caribbean (IDA & IBRD countries)LatviaLeast developed countries: UN classificationLebanonLesothoLiberiaLibyaLithuaniaLow & middle incomeLow incomeLower middle incomeLuxembourgMacao SAR, ChinaMacedonia, FYRMadagascarMalawiMalaysiaMaldivesMaliMaltaMauritaniaMauritiusMexicoMiddle East & North AfricaMiddle East & North Africa (excluding high income)Middle East & North Africa (IDA & IBRD countries)Middle incomeMoldovaMongoliaMoroccoMozambiqueMyanmarNamibiaNepalNetherlandsNew CaledoniaNew ZealandNicaraguaNigerNigeriaNorth AmericaNorwayOECD membersOmanOther small statesPacific island small statesPakistanPalauPanamaPapua New GuineaParaguayPeruPhilippinesPolandPortugalPost-demographic dividendPre-demographic dividendQatarRomaniaRussian FederationRwandaSamoaSao Tome and PrincipeSaudi ArabiaSenegalSerbiaSeychellesSierra LeoneSingaporeSlovak RepublicSloveniaSmall statesSolomon IslandsSomaliaSouth AfricaSouth AsiaSouth Asia (IDA & IBRD)SpainSri LankaSt. Kitts and NevisSt. LuciaSt. Vincent and the GrenadinesSub-Saharan Africa Sub-Saharan Africa (excluding high income)Sub-Saharan Africa (IDA & IBRD countries)SudanSurinameSwazilandSwedenSwitzerlandSyrian Arab RepublicTajikistanTanzaniaThailandTimor-LesteTogoTongaTrinidad and TobagoTunisiaTurkeyTurkmenistanTurks and Caicos IslandsTuvaluUgandaUkraineUnited Arab EmiratesUnited KingdomUnited StatesUpper middle incomeUruguayVanuatuVenezuela, RBVietnamVirgin Islands (U.S.)WorldYemen, Rep.ZambiaZimbabwe Timeline:
This timeline shows a graph from 1963 to 2011 of Libya. No data until 1962. Number of actual observations by date: 37.
Source name:
World Development Indicators
Source organization:
World Bank staff estimates from the Comtrade database maintained by the United Nations Statistics Division.
Categories, topics:
Agriculture & Rural Development, Private Sector, Trade
Last updated:
apr 23, 2017
Indicators value changes by year
At the date of observation
Value
Absolute change
Change from previous value
jan 1, 1963
1.391
+1.391
0.0%
jan 1, 1964
1.066
-0.324
-23.32%
jan 1, 1965
1.276
+0.21
19.65%
jan 1, 1966
1.407
+0.131
10.27%
jan 1, 1967
2.003
+0.596
42.34%
jan 1, 1968
1.86
-0.142
-7.1%
jan 1, 1969
1.658
-0.202
-10.86%
jan 1, 1970
1.253
-0.405
-24.42%
jan 1, 1971
1.421
+0.168
13.36%
jan 1, 1972
1.914
+0.493
34.73%
jan 1, 1973
2.313
+0.399
20.82%
jan 1, 1974
4.054
+1.741
75.28%
jan 1, 1975
3.211
-0.843
-20.79%
jan 1, 1976
1.949
-1.262
-39.29%
jan 1, 1977
1.619
-0.331
-16.96%
jan 1, 1978
2.152
+0.533
32.94%
jan 1, 1979
1.651
-0.501
-23.29%
jan 1, 1980
1.469
-0.181
-10.98%
jan 1, 1981
1.317
-0.152
-10.37%
jan 1, 1982
1.207
-0.11
-8.37%
jan 1, 1983
1.084
-0.123
-10.17%
jan 1, 1984
1.574
+0.49
45.18%
jan 1, 1985
1.318
-0.256
-16.26%
jan 1, 1986
0.994
-0.324
-24.56%
jan 1, 1987
1.001
+0.007
0.72%
jan 1, 1988
1.08
+0.079
7.88%
jan 1, 1989
0.665
-0.415
-38.42%
jan 1, 1990
1.241
+0.576
86.56%
jan 1, 1992
1.991
+0.75
60.45%
jan 1, 1998
0.907
-1.084
-54.45%
jan 1, 1999
0.918
+0.011
1.17%
jan 1, 2004
0.726
-0.192
-20.91%
jan 1, 2005
0.559
-0.167
-23.01%
jan 1, 2008
0.233
-0.326
-58.36%
jan 1, 2009
0.539
+0.306
131.69%
jan 1, 2010
0.629
+0.09
16.71%
jan 1, 2011
0.823
+0.194
30.77%
Ranking of countries by current statistics by years


Comments: