29
/
en
AIzaSyAYiBZKx7MnpbEhh9jyipgxe19OcubqV5w
April 1, 2024
268937
Turkey
TUR
true
2
1
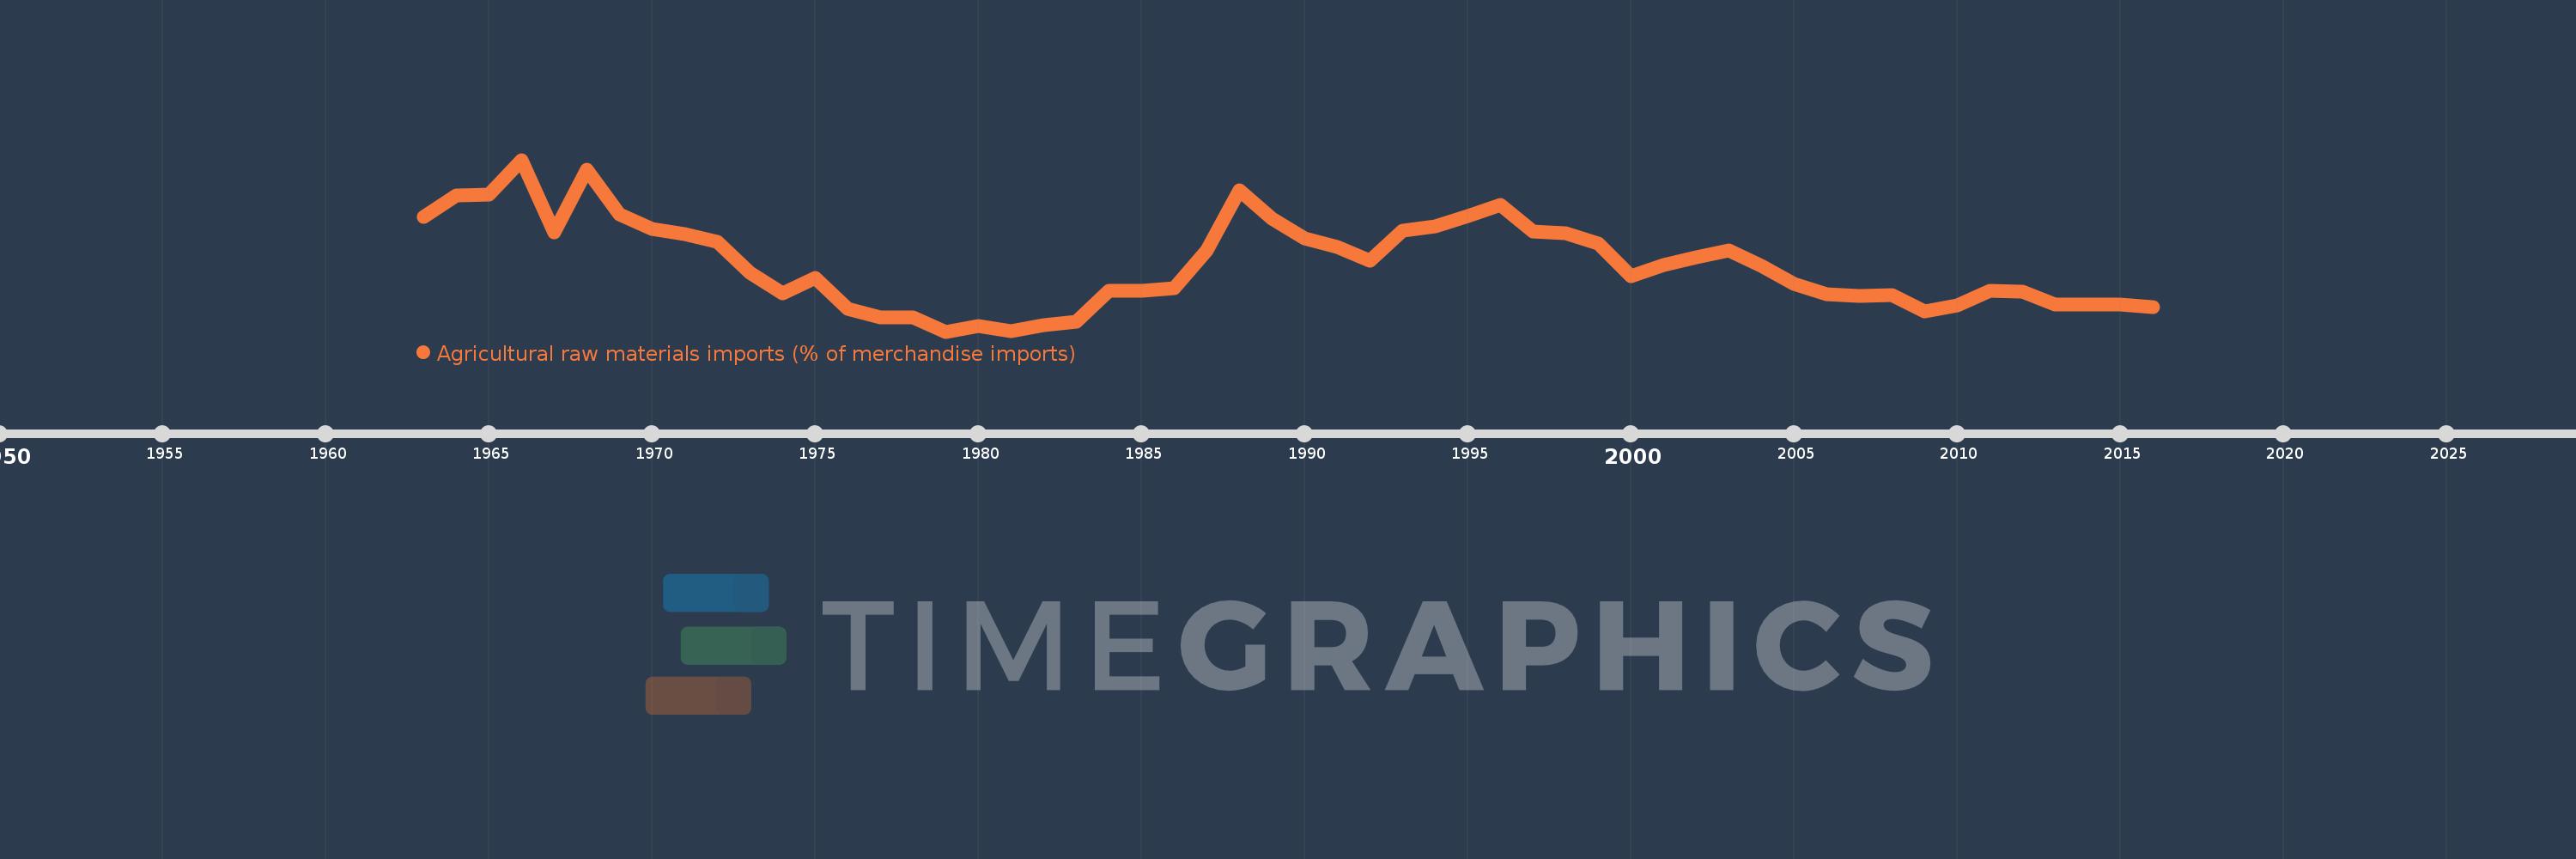
Agricultural raw materials imports (% of merchandise imports)
2016,2015,2014,2013,2012,2011,2010,2009,2008,2007,2006,2005,2004,2003,2002,2001,2000,1999,1998,1997,1996,1995,1994,1993,1992,1991,1990,1989,1988,1987,1986,1985,1984,1983,1982,1981,1980,1979,1978,1977,1976,1975,1974,1973,1972,1971,1970,1969,1968,1967,1966,1965,1964,1963
This statistics in other country:
AfghanistanAlbaniaAlgeriaAndorraAngolaAntigua and BarbudaArab WorldArgentinaArmeniaArubaAustraliaAustriaAzerbaijanBahamas, TheBahrainBangladeshBarbadosBelarusBelgiumBelizeBeninBermudaBhutanBoliviaBosnia and HerzegovinaBotswanaBrazilBrunei DarussalamBulgariaBurkina FasoBurundiCabo VerdeCambodiaCameroonCanadaCaribbean small statesCayman IslandsCentral African RepublicCentral Europe and the BalticsChadChileChinaColombiaComorosCongo, Dem. Rep.Congo, Rep.Costa RicaCote d'IvoireCroatiaCubaCyprusCzech RepublicDenmarkDjiboutiDominicaDominican RepublicEarly-demographic dividendEast Asia & PacificEast Asia & Pacific (excluding high income)East Asia & Pacific (IDA & IBRD countries)EcuadorEgypt, Arab Rep.El SalvadorEquatorial GuineaEritreaEstoniaEthiopiaEuro areaEurope & Central AsiaEurope & Central Asia (excluding high income)Europe & Central Asia (IDA & IBRD countries)European UnionFaroe IslandsFijiFinlandFragile and conflict affected situationsFranceFrench PolynesiaGabonGambia, TheGeorgiaGermanyGhanaGreeceGreenlandGrenadaGuatemalaGuineaGuinea-BissauGuyanaHaitiHeavily indebted poor countries (HIPC)High incomeHondurasHong Kong SAR, ChinaHungaryIBRD onlyIcelandIDA & IBRD totalIDA blendIDA onlyIDA totalIndiaIndonesiaIran, Islamic Rep.IraqIrelandIsraelItalyJamaicaJapanJordanKazakhstanKenyaKiribatiKorea, Rep.KuwaitKyrgyz RepublicLao PDRLate-demographic dividendLatin America & Caribbean Latin America & Caribbean (excluding high income)Latin America & the Caribbean (IDA & IBRD countries)LatviaLeast developed countries: UN classificationLebanonLesothoLiberiaLibyaLithuaniaLow & middle incomeLow incomeLower middle incomeLuxembourgMacao SAR, ChinaMacedonia, FYRMadagascarMalawiMalaysiaMaldivesMaliMaltaMauritaniaMauritiusMexicoMiddle East & North AfricaMiddle East & North Africa (excluding high income)Middle East & North Africa (IDA & IBRD countries)Middle incomeMoldovaMongoliaMoroccoMozambiqueMyanmarNamibiaNepalNetherlandsNew CaledoniaNew ZealandNicaraguaNigerNigeriaNorth AmericaNorwayOECD membersOmanOther small statesPacific island small statesPakistanPalauPanamaPapua New GuineaParaguayPeruPhilippinesPolandPortugalPost-demographic dividendPre-demographic dividendQatarRomaniaRussian FederationRwandaSamoaSao Tome and PrincipeSaudi ArabiaSenegalSerbiaSeychellesSierra LeoneSingaporeSlovak RepublicSloveniaSmall statesSolomon IslandsSomaliaSouth AfricaSouth AsiaSouth Asia (IDA & IBRD)SpainSri LankaSt. Kitts and NevisSt. LuciaSt. Vincent and the GrenadinesSub-Saharan Africa Sub-Saharan Africa (excluding high income)Sub-Saharan Africa (IDA & IBRD countries)SudanSurinameSwazilandSwedenSwitzerlandSyrian Arab RepublicTajikistanTanzaniaThailandTimor-LesteTogoTongaTrinidad and TobagoTunisiaTurkeyTurkmenistanTurks and Caicos IslandsTuvaluUgandaUkraineUnited Arab EmiratesUnited KingdomUnited StatesUpper middle incomeUruguayVanuatuVenezuela, RBVietnamVirgin Islands (U.S.)WorldYemen, Rep.ZambiaZimbabwe Timeline:
This timeline shows a graph from 1963 to 2016 of Turkey. No data until 1962. Number of actual observations by date: 54.
Source name:
World Development Indicators
Source organization:
World Bank staff estimates from the Comtrade database maintained by the United Nations Statistics Division.
Categories, topics:
Agriculture & Rural Development, Private Sector, Trade
Last updated:
apr 23, 2017
Indicators value changes by year
At the date of observation
Value
Absolute change
Change from previous value
jan 1, 1963
5.198
+5.198
0.0%
jan 1, 1964
5.875
+0.676
13.01%
jan 1, 1965
5.895
+0.021
0.36%
jan 1, 1966
6.983
+1.088
18.45%
jan 1, 1967
4.708
-2.275
-32.58%
jan 1, 1968
6.681
+1.973
41.9%
jan 1, 1969
5.285
-1.395
-20.89%
jan 1, 1970
4.812
-0.473
-8.96%
jan 1, 1971
4.659
-0.153
-3.18%
jan 1, 1972
4.422
-0.237
-5.08%
jan 1, 1973
3.445
-0.977
-22.1%
jan 1, 1974
2.819
-0.626
-18.16%
jan 1, 1975
3.305
+0.486
17.24%
jan 1, 1976
2.33
-0.975
-29.51%
jan 1, 1977
2.068
-0.262
-11.23%
jan 1, 1978
2.056
-0.012
-0.57%
jan 1, 1979
1.619
-0.437
-21.25%
jan 1, 1980
1.804
+0.185
11.42%
jan 1, 1981
1.626
-0.178
-9.87%
jan 1, 1982
1.815
+0.189
11.61%
jan 1, 1983
1.939
+0.124
6.85%
jan 1, 1984
2.896
+0.957
49.36%
jan 1, 1985
2.893
-0.003
-0.11%
jan 1, 1986
2.962
+0.069
2.4%
jan 1, 1987
4.164
+1.201
40.56%
jan 1, 1988
6.043
+1.88
45.14%
jan 1, 1989
5.159
-0.884
-14.63%
jan 1, 1990
4.533
-0.626
-12.14%
jan 1, 1991
4.263
-0.27
-5.96%
jan 1, 1992
3.841
-0.422
-9.9%
jan 1, 1993
4.758
+0.918
23.89%
jan 1, 1994
4.892
+0.134
2.82%
jan 1, 1995
5.238
+0.346
7.06%
jan 1, 1996
5.587
+0.349
6.67%
jan 1, 1997
4.734
-0.853
-15.27%
jan 1, 1998
4.69
-0.044
-0.93%
jan 1, 1999
4.377
-0.312
-6.66%
jan 1, 2000
3.342
-1.035
-23.64%
jan 1, 2001
3.704
+0.361
10.81%
jan 1, 2002
3.94
+0.236
6.38%
jan 1, 2003
4.164
+0.224
5.68%
jan 1, 2004
3.684
-0.48
-11.53%
jan 1, 2005
3.117
-0.567
-15.39%
jan 1, 2006
2.784
-0.333
-10.68%
jan 1, 2007
2.743
-0.041
-1.46%
jan 1, 2008
2.752
+0.009
0.33%
jan 1, 2009
2.245
-0.508
-18.44%
jan 1, 2010
2.432
+0.187
8.33%
jan 1, 2011
2.9
+0.468
19.24%
jan 1, 2012
2.869
-0.031
-1.05%
jan 1, 2013
2.46
-0.409
-14.26%
jan 1, 2014
2.477
+0.017
0.7%
jan 1, 2015
2.454
-0.023
-0.93%
jan 1, 2016
2.376
-0.078
-3.17%
Ranking of countries by current statistics by years


Comments: