29
/
en
AIzaSyAYiBZKx7MnpbEhh9jyipgxe19OcubqV5w
April 1, 2024
214030
Norway
NOR
true
2
1
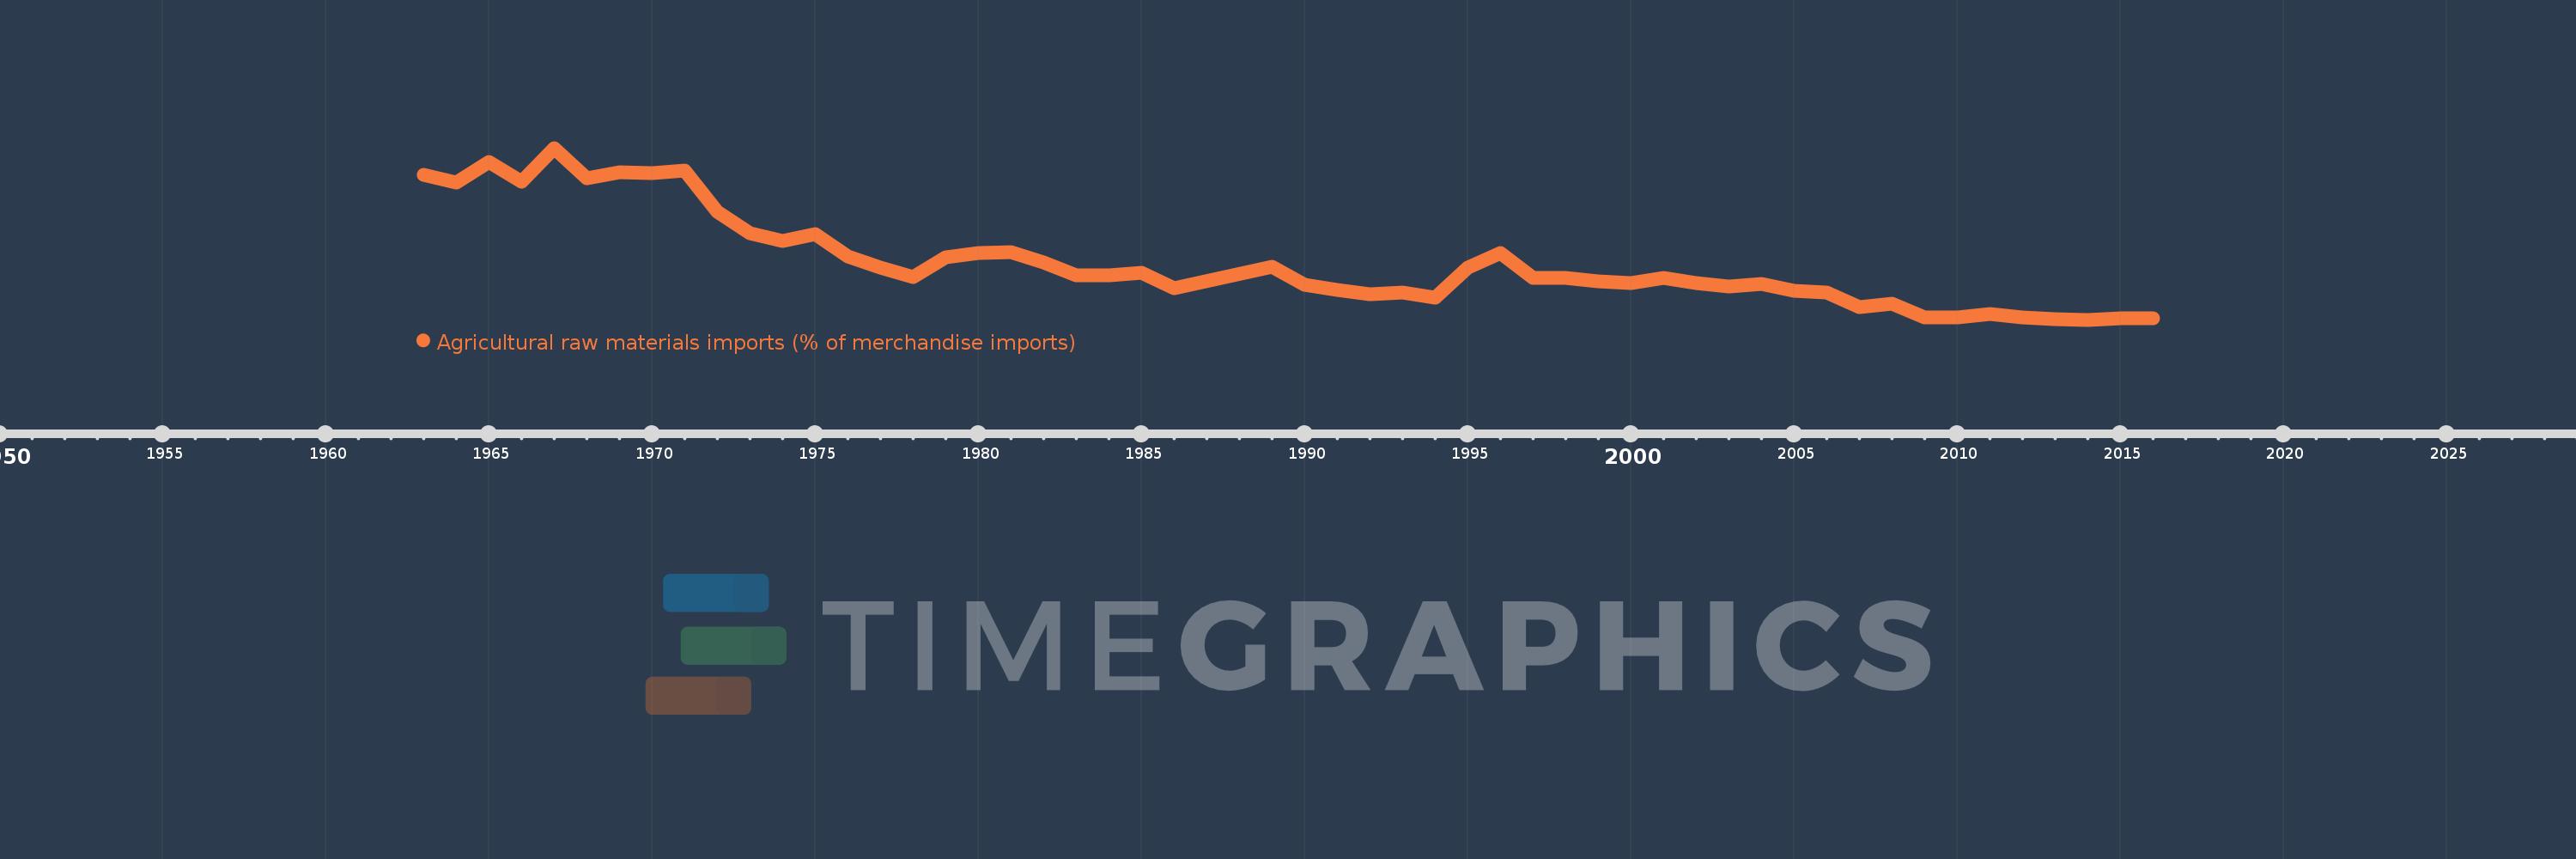
Agricultural raw materials imports (% of merchandise imports)
2016,2015,2014,2013,2012,2011,2010,2009,2008,2007,2006,2005,2004,2003,2002,2001,2000,1999,1998,1997,1996,1995,1994,1993,1992,1991,1990,1989,1986,1985,1984,1983,1982,1981,1980,1979,1978,1977,1976,1975,1974,1973,1972,1971,1970,1969,1968,1967,1966,1965,1964,1963
This statistics in other country:
AfghanistanAlbaniaAlgeriaAndorraAngolaAntigua and BarbudaArab WorldArgentinaArmeniaArubaAustraliaAustriaAzerbaijanBahamas, TheBahrainBangladeshBarbadosBelarusBelgiumBelizeBeninBermudaBhutanBoliviaBosnia and HerzegovinaBotswanaBrazilBrunei DarussalamBulgariaBurkina FasoBurundiCabo VerdeCambodiaCameroonCanadaCaribbean small statesCayman IslandsCentral African RepublicCentral Europe and the BalticsChadChileChinaColombiaComorosCongo, Dem. Rep.Congo, Rep.Costa RicaCote d'IvoireCroatiaCubaCyprusCzech RepublicDenmarkDjiboutiDominicaDominican RepublicEarly-demographic dividendEast Asia & PacificEast Asia & Pacific (excluding high income)East Asia & Pacific (IDA & IBRD countries)EcuadorEgypt, Arab Rep.El SalvadorEquatorial GuineaEritreaEstoniaEthiopiaEuro areaEurope & Central AsiaEurope & Central Asia (excluding high income)Europe & Central Asia (IDA & IBRD countries)European UnionFaroe IslandsFijiFinlandFragile and conflict affected situationsFranceFrench PolynesiaGabonGambia, TheGeorgiaGermanyGhanaGreeceGreenlandGrenadaGuatemalaGuineaGuinea-BissauGuyanaHaitiHeavily indebted poor countries (HIPC)High incomeHondurasHong Kong SAR, ChinaHungaryIBRD onlyIcelandIDA & IBRD totalIDA blendIDA onlyIDA totalIndiaIndonesiaIran, Islamic Rep.IraqIrelandIsraelItalyJamaicaJapanJordanKazakhstanKenyaKiribatiKorea, Rep.KuwaitKyrgyz RepublicLao PDRLate-demographic dividendLatin America & Caribbean Latin America & Caribbean (excluding high income)Latin America & the Caribbean (IDA & IBRD countries)LatviaLeast developed countries: UN classificationLebanonLesothoLiberiaLibyaLithuaniaLow & middle incomeLow incomeLower middle incomeLuxembourgMacao SAR, ChinaMacedonia, FYRMadagascarMalawiMalaysiaMaldivesMaliMaltaMauritaniaMauritiusMexicoMiddle East & North AfricaMiddle East & North Africa (excluding high income)Middle East & North Africa (IDA & IBRD countries)Middle incomeMoldovaMongoliaMoroccoMozambiqueMyanmarNamibiaNepalNetherlandsNew CaledoniaNew ZealandNicaraguaNigerNigeriaNorth AmericaNorwayOECD membersOmanOther small statesPacific island small statesPakistanPalauPanamaPapua New GuineaParaguayPeruPhilippinesPolandPortugalPost-demographic dividendPre-demographic dividendQatarRomaniaRussian FederationRwandaSamoaSao Tome and PrincipeSaudi ArabiaSenegalSerbiaSeychellesSierra LeoneSingaporeSlovak RepublicSloveniaSmall statesSolomon IslandsSomaliaSouth AfricaSouth AsiaSouth Asia (IDA & IBRD)SpainSri LankaSt. Kitts and NevisSt. LuciaSt. Vincent and the GrenadinesSub-Saharan Africa Sub-Saharan Africa (excluding high income)Sub-Saharan Africa (IDA & IBRD countries)SudanSurinameSwazilandSwedenSwitzerlandSyrian Arab RepublicTajikistanTanzaniaThailandTimor-LesteTogoTongaTrinidad and TobagoTunisiaTurkeyTurkmenistanTurks and Caicos IslandsTuvaluUgandaUkraineUnited Arab EmiratesUnited KingdomUnited StatesUpper middle incomeUruguayVanuatuVenezuela, RBVietnamVirgin Islands (U.S.)WorldYemen, Rep.ZambiaZimbabwe Timeline:
This timeline shows a graph from 1963 to 2016 of Norway. No data until 1962. Number of actual observations by date: 52.
Source name:
World Development Indicators
Source organization:
World Bank staff estimates from the Comtrade database maintained by the United Nations Statistics Division.
Categories, topics:
Agriculture & Rural Development, Private Sector, Trade
Last updated:
apr 23, 2017
Indicators value changes by year
At the date of observation
Value
Absolute change
Change from previous value
jan 1, 1963
4.226
+4.226
0.0%
jan 1, 1964
4.08
-0.146
-3.45%
jan 1, 1965
4.508
+0.428
10.49%
jan 1, 1966
4.094
-0.414
-9.17%
jan 1, 1967
4.792
+0.698
17.04%
jan 1, 1968
4.154
-0.638
-13.32%
jan 1, 1969
4.287
+0.134
3.21%
jan 1, 1970
4.276
-0.011
-0.26%
jan 1, 1971
4.316
+0.04
0.93%
jan 1, 1972
3.46
-0.856
-19.83%
jan 1, 1973
3.02
-0.44
-12.72%
jan 1, 1974
2.858
-0.162
-5.37%
jan 1, 1975
3.004
+0.146
5.12%
jan 1, 1976
2.534
-0.47
-15.64%
jan 1, 1977
2.298
-0.236
-9.32%
jan 1, 1978
2.111
-0.187
-8.13%
jan 1, 1979
2.51
+0.399
18.88%
jan 1, 1980
2.6
+0.09
3.6%
jan 1, 1981
2.631
+0.031
1.18%
jan 1, 1982
2.416
-0.214
-8.15%
jan 1, 1983
2.145
-0.271
-11.22%
jan 1, 1984
2.144
-0.001
-0.06%
jan 1, 1985
2.19
+0.046
2.15%
jan 1, 1986
1.872
-0.318
-14.51%
jan 1, 1989
2.327
+0.455
24.3%
jan 1, 1990
1.955
-0.372
-15.98%
jan 1, 1991
1.832
-0.124
-6.33%
jan 1, 1992
1.749
-0.082
-4.5%
jan 1, 1993
1.784
+0.035
1.98%
jan 1, 1994
1.687
-0.097
-5.42%
jan 1, 1995
2.31
+0.623
36.94%
jan 1, 1996
2.601
+0.291
12.57%
jan 1, 1997
2.082
-0.519
-19.95%
jan 1, 1998
2.086
+0.004
0.2%
jan 1, 1999
2.012
-0.075
-3.58%
jan 1, 2000
1.98
-0.031
-1.56%
jan 1, 2001
2.094
+0.114
5.73%
jan 1, 2002
1.985
-0.108
-5.18%
jan 1, 2003
1.915
-0.07
-3.52%
jan 1, 2004
1.964
+0.048
2.53%
jan 1, 2005
1.814
-0.15
-7.65%
jan 1, 2006
1.786
-0.027
-1.51%
jan 1, 2007
1.487
-0.3
-16.78%
jan 1, 2008
1.553
+0.066
4.47%
jan 1, 2009
1.275
-0.278
-17.91%
jan 1, 2010
1.273
-0.002
-0.13%
jan 1, 2011
1.339
+0.066
5.2%
jan 1, 2012
1.275
-0.064
-4.81%
jan 1, 2013
1.231
-0.044
-3.46%
jan 1, 2014
1.22
-0.011
-0.85%
jan 1, 2015
1.257
+0.037
3.05%
jan 1, 2016
1.243
-0.014
-1.14%
Ranking of countries by current statistics by years


Comments: