29
/
en
AIzaSyAYiBZKx7MnpbEhh9jyipgxe19OcubqV5w
April 1, 2024
62373
World
WLD
false
2
1
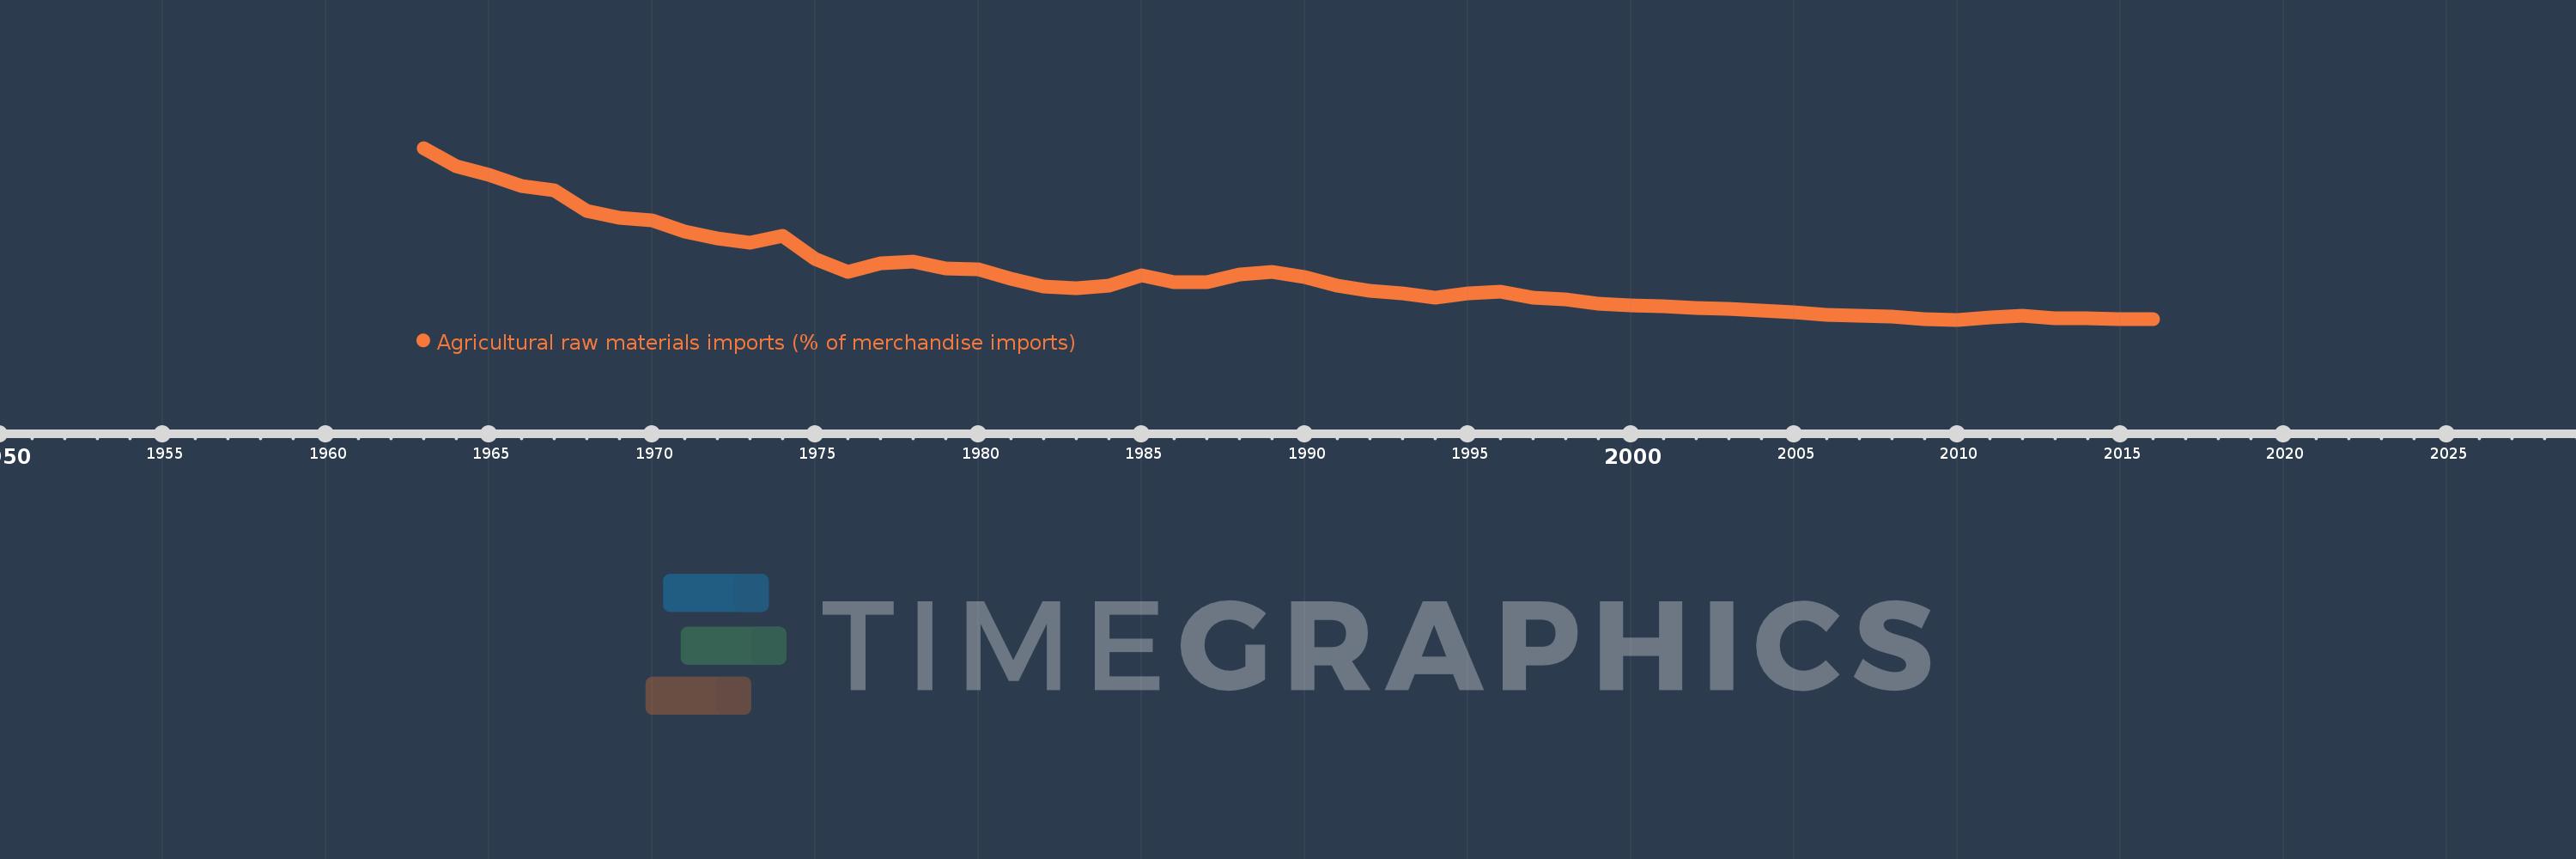
Agricultural raw materials imports (% of merchandise imports)
2016,2015,2014,2013,2012,2011,2010,2009,2008,2007,2006,2005,2004,2003,2002,2001,2000,1999,1998,1997,1996,1995,1994,1993,1992,1991,1990,1989,1988,1987,1986,1985,1984,1983,1982,1981,1980,1979,1978,1977,1976,1975,1974,1973,1972,1971,1970,1969,1968,1967,1966,1965,1964,1963
This statistics in other country:
AfghanistanAlbaniaAlgeriaAndorraAngolaAntigua and BarbudaArab WorldArgentinaArmeniaArubaAustraliaAustriaAzerbaijanBahamas, TheBahrainBangladeshBarbadosBelarusBelgiumBelizeBeninBermudaBhutanBoliviaBosnia and HerzegovinaBotswanaBrazilBrunei DarussalamBulgariaBurkina FasoBurundiCabo VerdeCambodiaCameroonCanadaCaribbean small statesCayman IslandsCentral African RepublicCentral Europe and the BalticsChadChileChinaColombiaComorosCongo, Dem. Rep.Congo, Rep.Costa RicaCote d'IvoireCroatiaCubaCyprusCzech RepublicDenmarkDjiboutiDominicaDominican RepublicEarly-demographic dividendEast Asia & PacificEast Asia & Pacific (excluding high income)East Asia & Pacific (IDA & IBRD countries)EcuadorEgypt, Arab Rep.El SalvadorEquatorial GuineaEritreaEstoniaEthiopiaEuro areaEurope & Central AsiaEurope & Central Asia (excluding high income)Europe & Central Asia (IDA & IBRD countries)European UnionFaroe IslandsFijiFinlandFragile and conflict affected situationsFranceFrench PolynesiaGabonGambia, TheGeorgiaGermanyGhanaGreeceGreenlandGrenadaGuatemalaGuineaGuinea-BissauGuyanaHaitiHeavily indebted poor countries (HIPC)High incomeHondurasHong Kong SAR, ChinaHungaryIBRD onlyIcelandIDA & IBRD totalIDA blendIDA onlyIDA totalIndiaIndonesiaIran, Islamic Rep.IraqIrelandIsraelItalyJamaicaJapanJordanKazakhstanKenyaKiribatiKorea, Rep.KuwaitKyrgyz RepublicLao PDRLate-demographic dividendLatin America & Caribbean Latin America & Caribbean (excluding high income)Latin America & the Caribbean (IDA & IBRD countries)LatviaLeast developed countries: UN classificationLebanonLesothoLiberiaLibyaLithuaniaLow & middle incomeLow incomeLower middle incomeLuxembourgMacao SAR, ChinaMacedonia, FYRMadagascarMalawiMalaysiaMaldivesMaliMaltaMauritaniaMauritiusMexicoMiddle East & North AfricaMiddle East & North Africa (excluding high income)Middle East & North Africa (IDA & IBRD countries)Middle incomeMoldovaMongoliaMoroccoMozambiqueMyanmarNamibiaNepalNetherlandsNew CaledoniaNew ZealandNicaraguaNigerNigeriaNorth AmericaNorwayOECD membersOmanOther small statesPacific island small statesPakistanPalauPanamaPapua New GuineaParaguayPeruPhilippinesPolandPortugalPost-demographic dividendPre-demographic dividendQatarRomaniaRussian FederationRwandaSamoaSao Tome and PrincipeSaudi ArabiaSenegalSerbiaSeychellesSierra LeoneSingaporeSlovak RepublicSloveniaSmall statesSolomon IslandsSomaliaSouth AfricaSouth AsiaSouth Asia (IDA & IBRD)SpainSri LankaSt. Kitts and NevisSt. LuciaSt. Vincent and the GrenadinesSub-Saharan Africa Sub-Saharan Africa (excluding high income)Sub-Saharan Africa (IDA & IBRD countries)SudanSurinameSwazilandSwedenSwitzerlandSyrian Arab RepublicTajikistanTanzaniaThailandTimor-LesteTogoTongaTrinidad and TobagoTunisiaTurkeyTurkmenistanTurks and Caicos IslandsTuvaluUgandaUkraineUnited Arab EmiratesUnited KingdomUnited StatesUpper middle incomeUruguayVanuatuVenezuela, RBVietnamVirgin Islands (U.S.)WorldYemen, Rep.ZambiaZimbabwe Timeline:
This timeline shows a graph from 1963 to 2016 of World. No data until 1962. Number of actual observations by date: 54.
Source name:
World Development Indicators
Source organization:
World Bank staff estimates from the Comtrade database maintained by the United Nations Statistics Division.
Categories, topics:
Agriculture & Rural Development, Private Sector, Trade
Last updated:
apr 23, 2017
Indicators value changes by year
Maximum:
11.792
jan 1, 1963
At the date of observation
Value
Absolute change
Change from previous value
jan 1, 1963
11.792
+11.792
0.0%
jan 1, 1964
10.668
-1.124
-9.53%
jan 1, 1965
10.183
-0.485
-4.55%
jan 1, 1966
9.498
-0.685
-6.72%
jan 1, 1967
9.266
-0.233
-2.45%
jan 1, 1968
7.984
-1.281
-13.83%
jan 1, 1969
7.601
-0.384
-4.81%
jan 1, 1970
7.436
-0.164
-2.16%
jan 1, 1971
6.736
-0.7
-9.42%
jan 1, 1972
6.33
-0.406
-6.03%
jan 1, 1973
6.104
-0.226
-3.57%
jan 1, 1974
6.482
+0.378
6.19%
jan 1, 1975
5.107
-1.375
-21.21%
jan 1, 1976
4.333
-0.774
-15.16%
jan 1, 1977
4.856
+0.524
12.08%
jan 1, 1978
4.952
+0.096
1.97%
jan 1, 1979
4.558
-0.394
-7.95%
jan 1, 1980
4.482
-0.076
-1.66%
jan 1, 1981
3.894
-0.588
-13.12%
jan 1, 1982
3.463
-0.432
-11.09%
jan 1, 1983
3.346
-0.117
-3.37%
jan 1, 1984
3.51
+0.164
4.91%
jan 1, 1985
4.105
+0.595
16.94%
jan 1, 1986
3.696
-0.409
-9.97%
jan 1, 1987
3.705
+0.01
0.26%
jan 1, 1988
4.15
+0.444
11.99%
jan 1, 1989
4.317
+0.167
4.03%
jan 1, 1990
3.998
-0.319
-7.39%
jan 1, 1991
3.492
-0.506
-12.65%
jan 1, 1992
3.169
-0.324
-9.26%
jan 1, 1993
3.021
-0.148
-4.68%
jan 1, 1994
2.783
-0.237
-7.86%
jan 1, 1995
3.037
+0.253
9.1%
jan 1, 1996
3.145
+0.109
3.59%
jan 1, 1997
2.755
-0.39
-12.41%
jan 1, 1998
2.676
-0.079
-2.88%
jan 1, 1999
2.418
-0.258
-9.64%
jan 1, 2000
2.291
-0.127
-5.24%
jan 1, 2001
2.262
-0.029
-1.25%
jan 1, 2002
2.163
-0.1
-4.41%
jan 1, 2003
2.082
-0.08
-3.71%
jan 1, 2004
1.997
-0.085
-4.1%
jan 1, 2005
1.918
-0.078
-3.93%
jan 1, 2006
1.76
-0.159
-8.27%
jan 1, 2007
1.694
-0.066
-3.72%
jan 1, 2008
1.619
-0.075
-4.44%
jan 1, 2009
1.485
-0.134
-8.3%
jan 1, 2010
1.449
-0.036
-2.41%
jan 1, 2011
1.604
+0.155
10.69%
jan 1, 2012
1.707
+0.103
6.42%
jan 1, 2013
1.526
-0.181
-10.6%
jan 1, 2014
1.518
-0.008
-0.55%
jan 1, 2015
1.483
-0.035
-2.29%
jan 1, 2016
1.495
+0.012
0.79%
Ranking of countries by current statistics by years


Comments: