29
/
en
AIzaSyAYiBZKx7MnpbEhh9jyipgxe19OcubqV5w
April 1, 2024
102124
Central African Republic
CAF
true
2
1
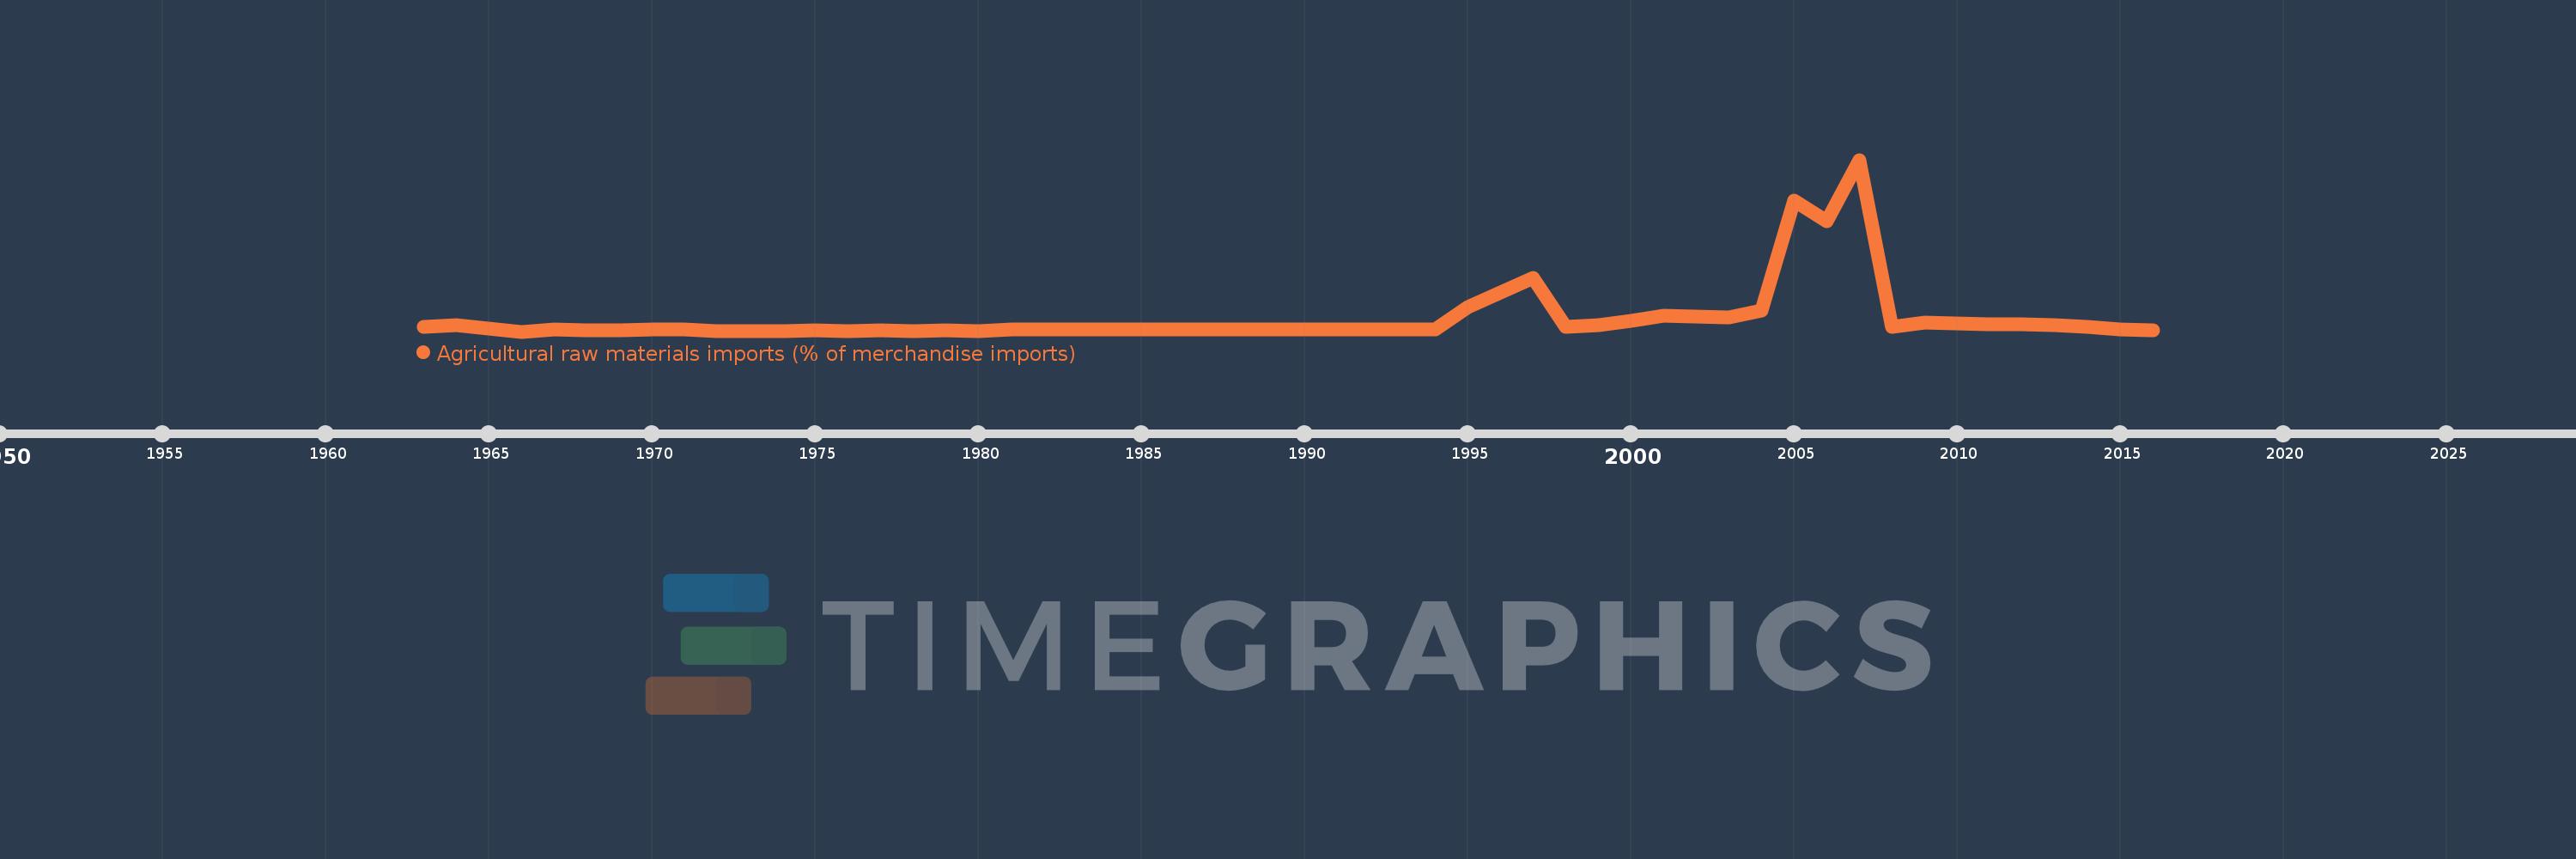
Agricultural raw materials imports (% of merchandise imports)
2016,2015,2014,2013,2012,2011,2010,2009,2008,2007,2006,2005,2004,2003,2002,2001,2000,1999,1998,1997,1996,1995,1994,1990,1981,1980,1979,1978,1977,1976,1975,1974,1972,1971,1970,1969,1968,1967,1966,1965,1964,1963
This statistics in other country:
AfghanistanAlbaniaAlgeriaAndorraAngolaAntigua and BarbudaArab WorldArgentinaArmeniaArubaAustraliaAustriaAzerbaijanBahamas, TheBahrainBangladeshBarbadosBelarusBelgiumBelizeBeninBermudaBhutanBoliviaBosnia and HerzegovinaBotswanaBrazilBrunei DarussalamBulgariaBurkina FasoBurundiCabo VerdeCambodiaCameroonCanadaCaribbean small statesCayman IslandsCentral African RepublicCentral Europe and the BalticsChadChileChinaColombiaComorosCongo, Dem. Rep.Congo, Rep.Costa RicaCote d'IvoireCroatiaCubaCyprusCzech RepublicDenmarkDjiboutiDominicaDominican RepublicEarly-demographic dividendEast Asia & PacificEast Asia & Pacific (excluding high income)East Asia & Pacific (IDA & IBRD countries)EcuadorEgypt, Arab Rep.El SalvadorEquatorial GuineaEritreaEstoniaEthiopiaEuro areaEurope & Central AsiaEurope & Central Asia (excluding high income)Europe & Central Asia (IDA & IBRD countries)European UnionFaroe IslandsFijiFinlandFragile and conflict affected situationsFranceFrench PolynesiaGabonGambia, TheGeorgiaGermanyGhanaGreeceGreenlandGrenadaGuatemalaGuineaGuinea-BissauGuyanaHaitiHeavily indebted poor countries (HIPC)High incomeHondurasHong Kong SAR, ChinaHungaryIBRD onlyIcelandIDA & IBRD totalIDA blendIDA onlyIDA totalIndiaIndonesiaIran, Islamic Rep.IraqIrelandIsraelItalyJamaicaJapanJordanKazakhstanKenyaKiribatiKorea, Rep.KuwaitKyrgyz RepublicLao PDRLate-demographic dividendLatin America & Caribbean Latin America & Caribbean (excluding high income)Latin America & the Caribbean (IDA & IBRD countries)LatviaLeast developed countries: UN classificationLebanonLesothoLiberiaLibyaLithuaniaLow & middle incomeLow incomeLower middle incomeLuxembourgMacao SAR, ChinaMacedonia, FYRMadagascarMalawiMalaysiaMaldivesMaliMaltaMauritaniaMauritiusMexicoMiddle East & North AfricaMiddle East & North Africa (excluding high income)Middle East & North Africa (IDA & IBRD countries)Middle incomeMoldovaMongoliaMoroccoMozambiqueMyanmarNamibiaNepalNetherlandsNew CaledoniaNew ZealandNicaraguaNigerNigeriaNorth AmericaNorwayOECD membersOmanOther small statesPacific island small statesPakistanPalauPanamaPapua New GuineaParaguayPeruPhilippinesPolandPortugalPost-demographic dividendPre-demographic dividendQatarRomaniaRussian FederationRwandaSamoaSao Tome and PrincipeSaudi ArabiaSenegalSerbiaSeychellesSierra LeoneSingaporeSlovak RepublicSloveniaSmall statesSolomon IslandsSomaliaSouth AfricaSouth AsiaSouth Asia (IDA & IBRD)SpainSri LankaSt. Kitts and NevisSt. LuciaSt. Vincent and the GrenadinesSub-Saharan Africa Sub-Saharan Africa (excluding high income)Sub-Saharan Africa (IDA & IBRD countries)SudanSurinameSwazilandSwedenSwitzerlandSyrian Arab RepublicTajikistanTanzaniaThailandTimor-LesteTogoTongaTrinidad and TobagoTunisiaTurkeyTurkmenistanTurks and Caicos IslandsTuvaluUgandaUkraineUnited Arab EmiratesUnited KingdomUnited StatesUpper middle incomeUruguayVanuatuVenezuela, RBVietnamVirgin Islands (U.S.)WorldYemen, Rep.ZambiaZimbabwe Timeline:
This timeline shows a graph from 1963 to 2016 of Central African Republic. No data until 1962. Number of actual observations by date: 42.
Source name:
World Development Indicators
Source organization:
World Bank staff estimates from the Comtrade database maintained by the United Nations Statistics Division.
Categories, topics:
Agriculture & Rural Development, Private Sector, Trade
Last updated:
apr 23, 2017
Indicators value changes by year
Maximum:
42.321
jan 1, 2007
At the date of observation
Value
Absolute change
Change from previous value
jan 1, 1963
1.435
+1.435
0.0%
jan 1, 1964
1.94
+0.505
35.22%
jan 1, 1965
1.119
-0.821
-42.33%
jan 1, 1966
0.372
-0.747
-66.77%
jan 1, 1967
0.834
+0.462
124.33%
jan 1, 1968
0.768
-0.066
-7.91%
jan 1, 1969
0.685
-0.083
-10.84%
jan 1, 1970
0.958
+0.273
39.89%
jan 1, 1971
0.962
+0.004
0.41%
jan 1, 1972
0.465
-0.497
-51.69%
jan 1, 1974
0.453
-0.012
-2.48%
jan 1, 1975
0.661
+0.208
45.91%
jan 1, 1976
0.384
-0.277
-41.93%
jan 1, 1977
0.583
+0.199
51.75%
jan 1, 1978
0.477
-0.105
-18.07%
jan 1, 1979
0.667
+0.19
39.73%
jan 1, 1980
0.389
-0.278
-41.65%
jan 1, 1981
0.906
+0.517
132.86%
jan 1, 1990
0.959
+0.052
5.79%
jan 1, 1994
0.899
-0.06
-6.22%
jan 1, 1995
6.253
+5.354
595.32%
jan 1, 1996
9.839
+3.586
57.34%
jan 1, 1997
13.544
+3.705
37.65%
jan 1, 1998
1.566
-11.978
-88.44%
jan 1, 1999
1.962
+0.396
25.3%
jan 1, 2000
2.924
+0.961
48.99%
jan 1, 2001
4.298
+1.374
47.01%
jan 1, 2002
4.105
-0.193
-4.49%
jan 1, 2003
3.741
-0.364
-8.87%
jan 1, 2004
5.446
+1.705
45.58%
jan 1, 2005
32.431
+26.985
495.48%
jan 1, 2006
27.361
-5.071
-15.63%
jan 1, 2007
42.321
+14.961
54.68%
jan 1, 2008
1.539
-40.782
-96.36%
jan 1, 2009
2.512
+0.973
63.22%
jan 1, 2010
2.27
-0.243
-9.66%
jan 1, 2011
2.091
-0.179
-7.9%
jan 1, 2012
2.121
+0.03
1.44%
jan 1, 2013
2.011
-0.109
-5.16%
jan 1, 2014
1.594
-0.417
-20.76%
jan 1, 2015
0.819
-0.775
-48.61%
jan 1, 2016
0.71
-0.109
-13.27%
Ranking of countries by current statistics by years


Comments: