29
/
en
AIzaSyAYiBZKx7MnpbEhh9jyipgxe19OcubqV5w
April 1, 2024
231949
Samoa
WSM
true
2
1
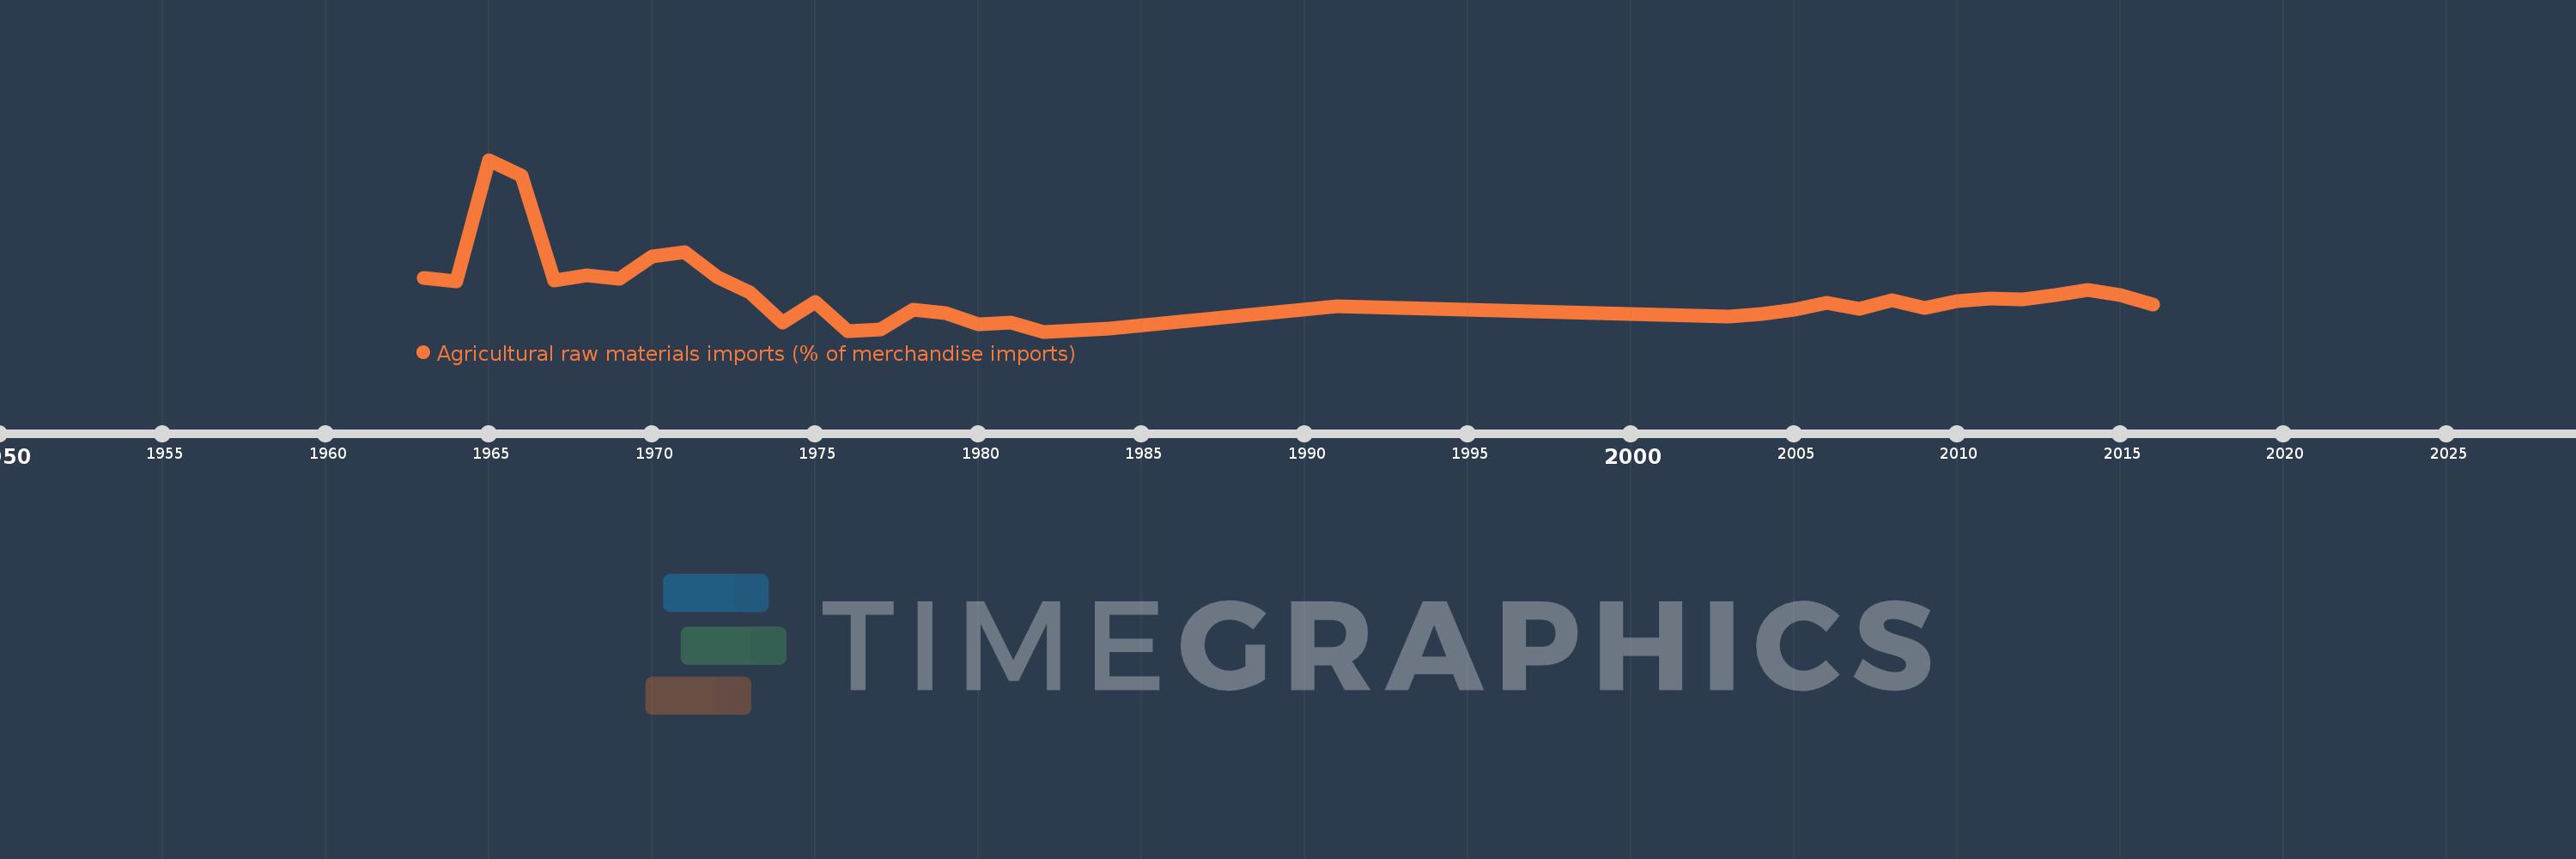
Agricultural raw materials imports (% of merchandise imports)
2016,2015,2014,2013,2012,2011,2010,2009,2008,2007,2006,2005,2004,2003,2002,1991,1984,1983,1982,1981,1980,1979,1978,1977,1976,1975,1974,1973,1972,1971,1970,1969,1968,1967,1966,1965,1964,1963
This statistics in other country:
AfghanistanAlbaniaAlgeriaAndorraAngolaAntigua and BarbudaArab WorldArgentinaArmeniaArubaAustraliaAustriaAzerbaijanBahamas, TheBahrainBangladeshBarbadosBelarusBelgiumBelizeBeninBermudaBhutanBoliviaBosnia and HerzegovinaBotswanaBrazilBrunei DarussalamBulgariaBurkina FasoBurundiCabo VerdeCambodiaCameroonCanadaCaribbean small statesCayman IslandsCentral African RepublicCentral Europe and the BalticsChadChileChinaColombiaComorosCongo, Dem. Rep.Congo, Rep.Costa RicaCote d'IvoireCroatiaCubaCyprusCzech RepublicDenmarkDjiboutiDominicaDominican RepublicEarly-demographic dividendEast Asia & PacificEast Asia & Pacific (excluding high income)East Asia & Pacific (IDA & IBRD countries)EcuadorEgypt, Arab Rep.El SalvadorEquatorial GuineaEritreaEstoniaEthiopiaEuro areaEurope & Central AsiaEurope & Central Asia (excluding high income)Europe & Central Asia (IDA & IBRD countries)European UnionFaroe IslandsFijiFinlandFragile and conflict affected situationsFranceFrench PolynesiaGabonGambia, TheGeorgiaGermanyGhanaGreeceGreenlandGrenadaGuatemalaGuineaGuinea-BissauGuyanaHaitiHeavily indebted poor countries (HIPC)High incomeHondurasHong Kong SAR, ChinaHungaryIBRD onlyIcelandIDA & IBRD totalIDA blendIDA onlyIDA totalIndiaIndonesiaIran, Islamic Rep.IraqIrelandIsraelItalyJamaicaJapanJordanKazakhstanKenyaKiribatiKorea, Rep.KuwaitKyrgyz RepublicLao PDRLate-demographic dividendLatin America & Caribbean Latin America & Caribbean (excluding high income)Latin America & the Caribbean (IDA & IBRD countries)LatviaLeast developed countries: UN classificationLebanonLesothoLiberiaLibyaLithuaniaLow & middle incomeLow incomeLower middle incomeLuxembourgMacao SAR, ChinaMacedonia, FYRMadagascarMalawiMalaysiaMaldivesMaliMaltaMauritaniaMauritiusMexicoMiddle East & North AfricaMiddle East & North Africa (excluding high income)Middle East & North Africa (IDA & IBRD countries)Middle incomeMoldovaMongoliaMoroccoMozambiqueMyanmarNamibiaNepalNetherlandsNew CaledoniaNew ZealandNicaraguaNigerNigeriaNorth AmericaNorwayOECD membersOmanOther small statesPacific island small statesPakistanPalauPanamaPapua New GuineaParaguayPeruPhilippinesPolandPortugalPost-demographic dividendPre-demographic dividendQatarRomaniaRussian FederationRwandaSamoaSao Tome and PrincipeSaudi ArabiaSenegalSerbiaSeychellesSierra LeoneSingaporeSlovak RepublicSloveniaSmall statesSolomon IslandsSomaliaSouth AfricaSouth AsiaSouth Asia (IDA & IBRD)SpainSri LankaSt. Kitts and NevisSt. LuciaSt. Vincent and the GrenadinesSub-Saharan Africa Sub-Saharan Africa (excluding high income)Sub-Saharan Africa (IDA & IBRD countries)SudanSurinameSwazilandSwedenSwitzerlandSyrian Arab RepublicTajikistanTanzaniaThailandTimor-LesteTogoTongaTrinidad and TobagoTunisiaTurkeyTurkmenistanTurks and Caicos IslandsTuvaluUgandaUkraineUnited Arab EmiratesUnited KingdomUnited StatesUpper middle incomeUruguayVanuatuVenezuela, RBVietnamVirgin Islands (U.S.)WorldYemen, Rep.ZambiaZimbabwe Timeline:
This timeline shows a graph from 1963 to 2016 of Samoa. No data until 1962. Number of actual observations by date: 38.
Source name:
World Development Indicators
Source organization:
World Bank staff estimates from the Comtrade database maintained by the United Nations Statistics Division.
Categories, topics:
Agriculture & Rural Development, Private Sector, Trade
Last updated:
apr 23, 2017
Indicators value changes by year
At the date of observation
Value
Absolute change
Change from previous value
jan 1, 1963
3.386
+3.386
0.0%
jan 1, 1964
3.202
-0.184
-5.42%
jan 1, 1965
9.523
+6.321
197.41%
jan 1, 1966
8.685
-0.839
-8.8%
jan 1, 1967
3.254
-5.431
-62.53%
jan 1, 1968
3.509
+0.255
7.84%
jan 1, 1969
3.347
-0.162
-4.63%
jan 1, 1970
4.484
+1.138
33.99%
jan 1, 1971
4.735
+0.251
5.59%
jan 1, 1972
3.414
-1.321
-27.89%
jan 1, 1973
2.618
-0.796
-23.31%
jan 1, 1974
1.073
-1.545
-59.02%
jan 1, 1975
2.147
+1.074
100.12%
jan 1, 1976
0.592
-1.555
-72.43%
jan 1, 1977
0.705
+0.113
19.06%
jan 1, 1978
1.702
+0.997
141.44%
jan 1, 1979
1.561
-0.14
-8.25%
jan 1, 1980
0.95
-0.611
-39.14%
jan 1, 1981
1.067
+0.117
12.32%
jan 1, 1982
0.583
-0.485
-45.4%
jan 1, 1983
0.656
+0.073
12.52%
jan 1, 1984
0.755
+0.099
15.09%
jan 1, 1991
1.883
+1.128
149.53%
jan 1, 2002
1.418
-0.465
-24.71%
jan 1, 2003
1.387
-0.031
-2.17%
jan 1, 2004
1.512
+0.125
9.03%
jan 1, 2005
1.716
+0.204
13.48%
jan 1, 2006
2.094
+0.378
22.02%
jan 1, 2007
1.777
-0.317
-15.13%
jan 1, 2008
2.234
+0.457
25.71%
jan 1, 2009
1.804
-0.43
-19.24%
jan 1, 2010
2.17
+0.365
20.26%
jan 1, 2011
2.298
+0.129
5.93%
jan 1, 2012
2.277
-0.021
-0.93%
jan 1, 2013
2.48
+0.203
8.93%
jan 1, 2014
2.734
+0.253
10.22%
jan 1, 2015
2.472
-0.262
-9.59%
jan 1, 2016
1.983
-0.489
-19.78%
Ranking of countries by current statistics by years


Comments: