29
/
en
AIzaSyAYiBZKx7MnpbEhh9jyipgxe19OcubqV5w
April 1, 2024
164459
Jordan
JOR
true
2
1
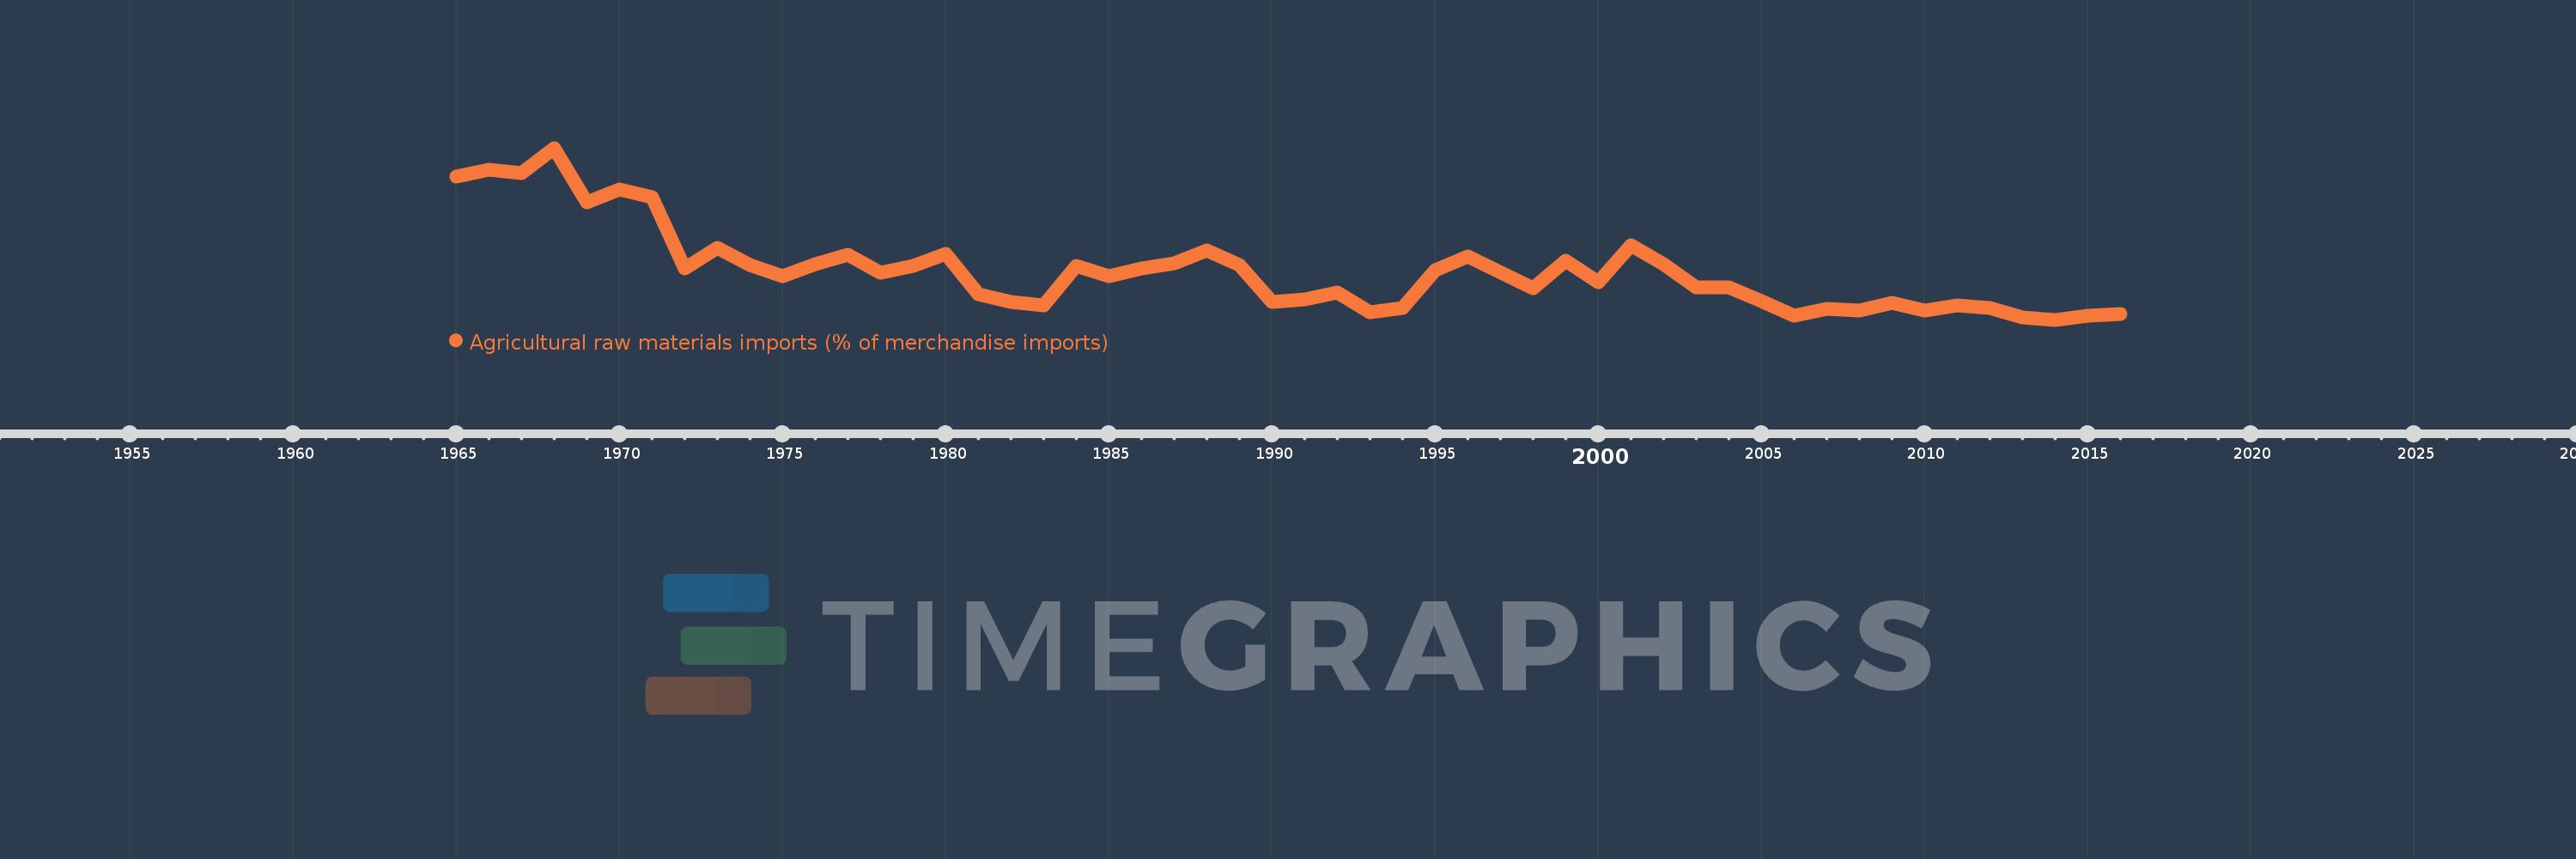
Agricultural raw materials imports (% of merchandise imports)
2016,2015,2014,2013,2012,2011,2010,2009,2008,2007,2006,2005,2004,2003,2002,2001,2000,1999,1998,1996,1995,1994,1993,1992,1991,1990,1989,1988,1987,1986,1985,1984,1983,1982,1981,1980,1979,1978,1977,1976,1975,1974,1973,1972,1971,1970,1969,1968,1967,1966,1965
This statistics in other country:
AfghanistanAlbaniaAlgeriaAndorraAngolaAntigua and BarbudaArab WorldArgentinaArmeniaArubaAustraliaAustriaAzerbaijanBahamas, TheBahrainBangladeshBarbadosBelarusBelgiumBelizeBeninBermudaBhutanBoliviaBosnia and HerzegovinaBotswanaBrazilBrunei DarussalamBulgariaBurkina FasoBurundiCabo VerdeCambodiaCameroonCanadaCaribbean small statesCayman IslandsCentral African RepublicCentral Europe and the BalticsChadChileChinaColombiaComorosCongo, Dem. Rep.Congo, Rep.Costa RicaCote d'IvoireCroatiaCubaCyprusCzech RepublicDenmarkDjiboutiDominicaDominican RepublicEarly-demographic dividendEast Asia & PacificEast Asia & Pacific (excluding high income)East Asia & Pacific (IDA & IBRD countries)EcuadorEgypt, Arab Rep.El SalvadorEquatorial GuineaEritreaEstoniaEthiopiaEuro areaEurope & Central AsiaEurope & Central Asia (excluding high income)Europe & Central Asia (IDA & IBRD countries)European UnionFaroe IslandsFijiFinlandFragile and conflict affected situationsFranceFrench PolynesiaGabonGambia, TheGeorgiaGermanyGhanaGreeceGreenlandGrenadaGuatemalaGuineaGuinea-BissauGuyanaHaitiHeavily indebted poor countries (HIPC)High incomeHondurasHong Kong SAR, ChinaHungaryIBRD onlyIcelandIDA & IBRD totalIDA blendIDA onlyIDA totalIndiaIndonesiaIran, Islamic Rep.IraqIrelandIsraelItalyJamaicaJapanJordanKazakhstanKenyaKiribatiKorea, Rep.KuwaitKyrgyz RepublicLao PDRLate-demographic dividendLatin America & Caribbean Latin America & Caribbean (excluding high income)Latin America & the Caribbean (IDA & IBRD countries)LatviaLeast developed countries: UN classificationLebanonLesothoLiberiaLibyaLithuaniaLow & middle incomeLow incomeLower middle incomeLuxembourgMacao SAR, ChinaMacedonia, FYRMadagascarMalawiMalaysiaMaldivesMaliMaltaMauritaniaMauritiusMexicoMiddle East & North AfricaMiddle East & North Africa (excluding high income)Middle East & North Africa (IDA & IBRD countries)Middle incomeMoldovaMongoliaMoroccoMozambiqueMyanmarNamibiaNepalNetherlandsNew CaledoniaNew ZealandNicaraguaNigerNigeriaNorth AmericaNorwayOECD membersOmanOther small statesPacific island small statesPakistanPalauPanamaPapua New GuineaParaguayPeruPhilippinesPolandPortugalPost-demographic dividendPre-demographic dividendQatarRomaniaRussian FederationRwandaSamoaSao Tome and PrincipeSaudi ArabiaSenegalSerbiaSeychellesSierra LeoneSingaporeSlovak RepublicSloveniaSmall statesSolomon IslandsSomaliaSouth AfricaSouth AsiaSouth Asia (IDA & IBRD)SpainSri LankaSt. Kitts and NevisSt. LuciaSt. Vincent and the GrenadinesSub-Saharan Africa Sub-Saharan Africa (excluding high income)Sub-Saharan Africa (IDA & IBRD countries)SudanSurinameSwazilandSwedenSwitzerlandSyrian Arab RepublicTajikistanTanzaniaThailandTimor-LesteTogoTongaTrinidad and TobagoTunisiaTurkeyTurkmenistanTurks and Caicos IslandsTuvaluUgandaUkraineUnited Arab EmiratesUnited KingdomUnited StatesUpper middle incomeUruguayVanuatuVenezuela, RBVietnamVirgin Islands (U.S.)WorldYemen, Rep.ZambiaZimbabwe Timeline:
This timeline shows a graph from 1965 to 2016 of Jordan. No data until 1964. Number of actual observations by date: 51.
Source name:
World Development Indicators
Source organization:
World Bank staff estimates from the Comtrade database maintained by the United Nations Statistics Division.
Categories, topics:
Agriculture & Rural Development, Private Sector, Trade
Last updated:
apr 23, 2017
Indicators value changes by year
At the date of observation
Value
Absolute change
Change from previous value
jan 1, 1965
3.363
+3.363
0.0%
jan 1, 1966
3.463
+0.1
2.98%
jan 1, 1967
3.414
-0.049
-1.42%
jan 1, 1968
3.805
+0.391
11.44%
jan 1, 1969
2.953
-0.852
-22.39%
jan 1, 1970
3.159
+0.206
6.98%
jan 1, 1971
3.035
-0.124
-3.91%
jan 1, 1972
1.923
-1.112
-36.64%
jan 1, 1973
2.253
+0.33
17.17%
jan 1, 1974
1.981
-0.272
-12.09%
jan 1, 1975
1.807
-0.174
-8.77%
jan 1, 1976
1.99
+0.183
10.12%
jan 1, 1977
2.143
+0.153
7.7%
jan 1, 1978
1.86
-0.283
-13.22%
jan 1, 1979
1.963
+0.103
5.55%
jan 1, 1980
2.158
+0.195
9.92%
jan 1, 1981
1.529
-0.629
-29.14%
jan 1, 1982
1.398
-0.131
-8.57%
jan 1, 1983
1.355
-0.043
-3.08%
jan 1, 1984
1.962
+0.607
44.79%
jan 1, 1985
1.802
-0.16
-8.16%
jan 1, 1986
1.93
+0.128
7.12%
jan 1, 1987
2.001
+0.071
3.69%
jan 1, 1988
2.203
+0.202
10.08%
jan 1, 1989
1.98
-0.223
-10.13%
jan 1, 1990
1.402
-0.578
-29.18%
jan 1, 1991
1.44
+0.038
2.68%
jan 1, 1992
1.55
+0.11
7.66%
jan 1, 1993
1.248
-0.303
-19.53%
jan 1, 1994
1.31
+0.063
5.04%
jan 1, 1995
1.902
+0.591
45.12%
jan 1, 1996
2.116
+0.214
11.26%
jan 1, 1998
1.616
-0.499
-23.6%
jan 1, 1999
2.043
+0.427
26.42%
jan 1, 2000
1.717
-0.326
-15.96%
jan 1, 2001
2.285
+0.568
33.06%
jan 1, 2002
1.993
-0.292
-12.76%
jan 1, 2003
1.629
-0.364
-18.28%
jan 1, 2004
1.631
+0.002
0.1%
jan 1, 2005
1.416
-0.215
-13.19%
jan 1, 2006
1.183
-0.232
-16.42%
jan 1, 2007
1.295
+0.112
9.43%
jan 1, 2008
1.271
-0.024
-1.83%
jan 1, 2009
1.393
+0.122
9.59%
jan 1, 2010
1.269
-0.124
-8.89%
jan 1, 2011
1.343
+0.074
5.85%
jan 1, 2012
1.304
-0.039
-2.89%
jan 1, 2013
1.157
-0.148
-11.32%
jan 1, 2014
1.126
-0.031
-2.67%
jan 1, 2015
1.188
+0.063
5.56%
jan 1, 2016
1.22
+0.031
2.65%
Ranking of countries by current statistics by years


Comments: