29
/
en
AIzaSyAYiBZKx7MnpbEhh9jyipgxe19OcubqV5w
April 1, 2024
163499
Japan
JPN
true
2
1
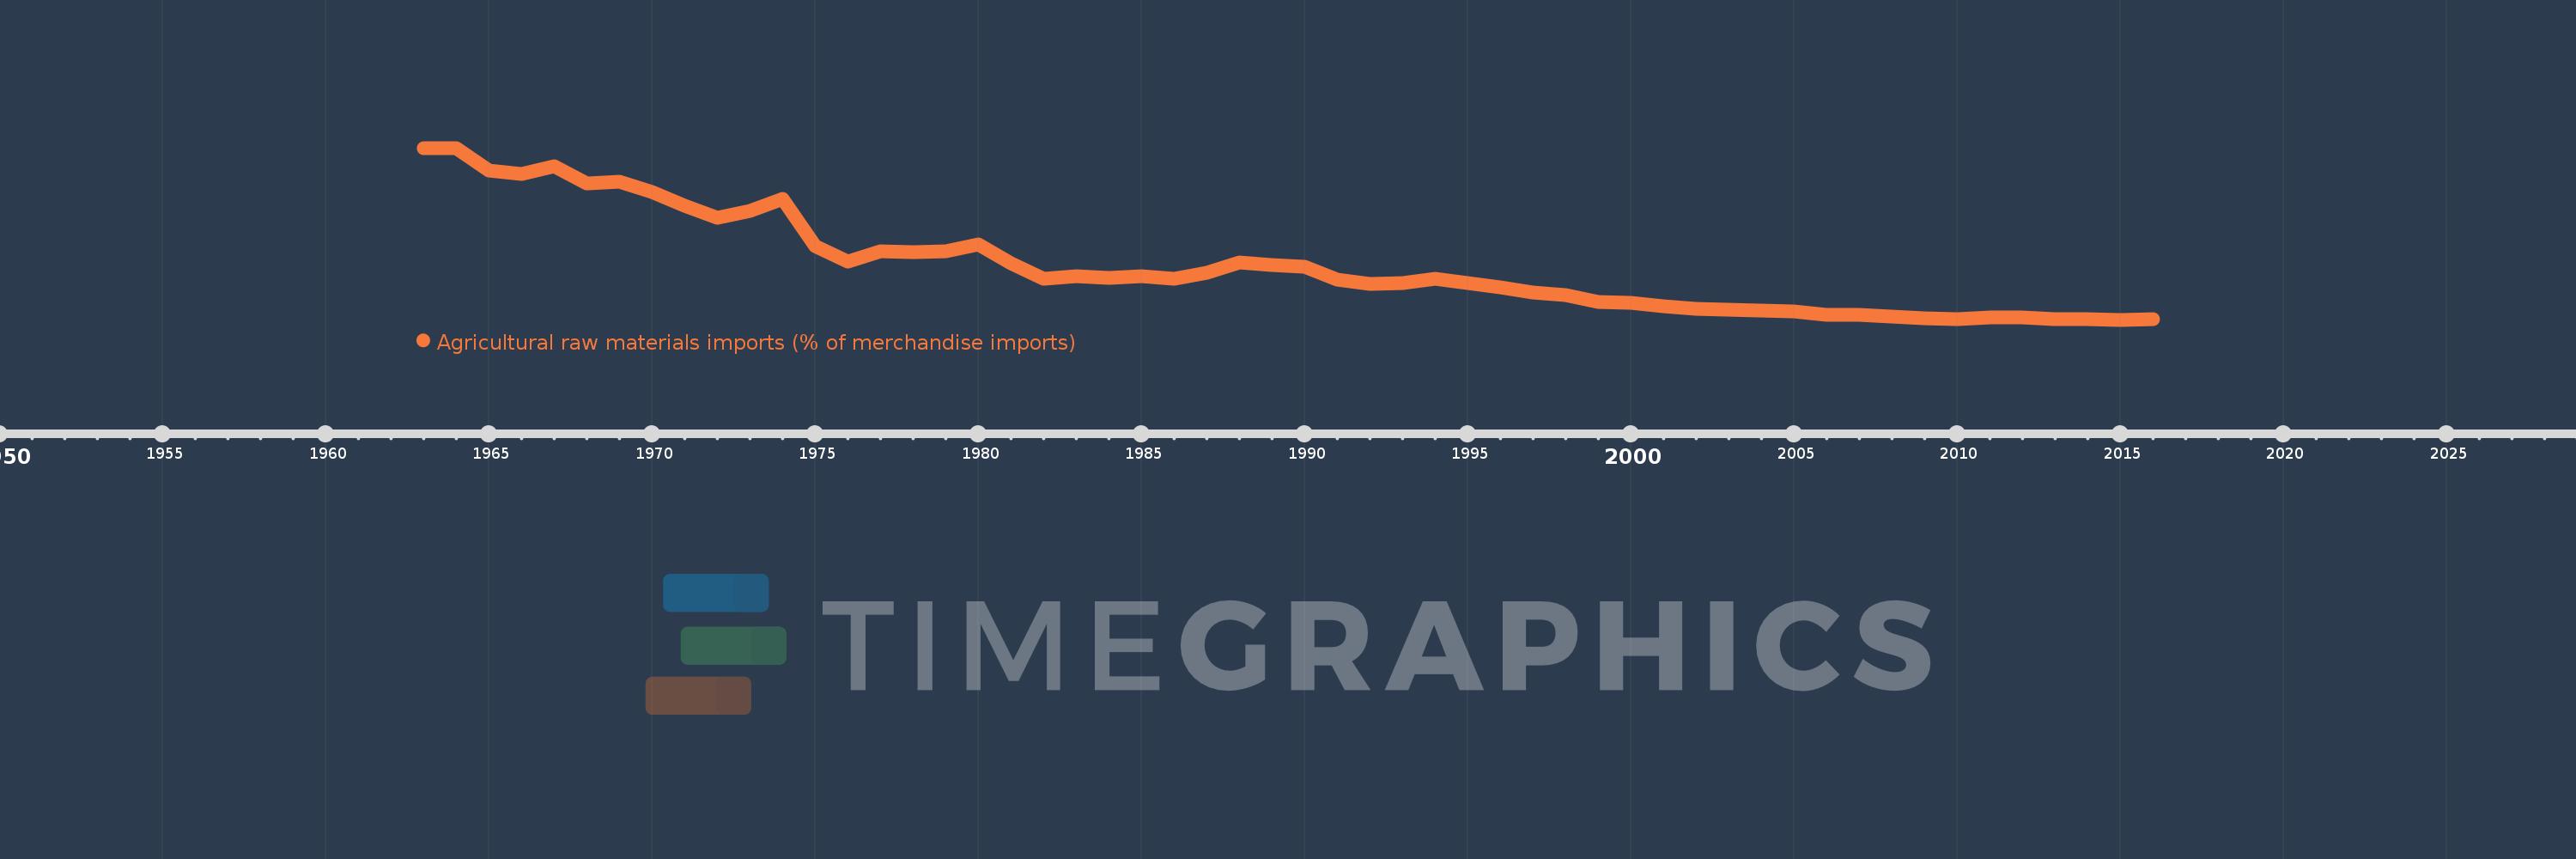
Agricultural raw materials imports (% of merchandise imports)
2016,2015,2014,2013,2012,2011,2010,2009,2008,2007,2006,2005,2004,2003,2002,2001,2000,1999,1998,1997,1996,1995,1994,1993,1992,1991,1990,1989,1988,1987,1986,1985,1984,1983,1982,1981,1980,1979,1978,1977,1976,1975,1974,1973,1972,1971,1970,1969,1968,1967,1966,1965,1964,1963
This statistics in other country:
AfghanistanAlbaniaAlgeriaAndorraAngolaAntigua and BarbudaArab WorldArgentinaArmeniaArubaAustraliaAustriaAzerbaijanBahamas, TheBahrainBangladeshBarbadosBelarusBelgiumBelizeBeninBermudaBhutanBoliviaBosnia and HerzegovinaBotswanaBrazilBrunei DarussalamBulgariaBurkina FasoBurundiCabo VerdeCambodiaCameroonCanadaCaribbean small statesCayman IslandsCentral African RepublicCentral Europe and the BalticsChadChileChinaColombiaComorosCongo, Dem. Rep.Congo, Rep.Costa RicaCote d'IvoireCroatiaCubaCyprusCzech RepublicDenmarkDjiboutiDominicaDominican RepublicEarly-demographic dividendEast Asia & PacificEast Asia & Pacific (excluding high income)East Asia & Pacific (IDA & IBRD countries)EcuadorEgypt, Arab Rep.El SalvadorEquatorial GuineaEritreaEstoniaEthiopiaEuro areaEurope & Central AsiaEurope & Central Asia (excluding high income)Europe & Central Asia (IDA & IBRD countries)European UnionFaroe IslandsFijiFinlandFragile and conflict affected situationsFranceFrench PolynesiaGabonGambia, TheGeorgiaGermanyGhanaGreeceGreenlandGrenadaGuatemalaGuineaGuinea-BissauGuyanaHaitiHeavily indebted poor countries (HIPC)High incomeHondurasHong Kong SAR, ChinaHungaryIBRD onlyIcelandIDA & IBRD totalIDA blendIDA onlyIDA totalIndiaIndonesiaIran, Islamic Rep.IraqIrelandIsraelItalyJamaicaJapanJordanKazakhstanKenyaKiribatiKorea, Rep.KuwaitKyrgyz RepublicLao PDRLate-demographic dividendLatin America & Caribbean Latin America & Caribbean (excluding high income)Latin America & the Caribbean (IDA & IBRD countries)LatviaLeast developed countries: UN classificationLebanonLesothoLiberiaLibyaLithuaniaLow & middle incomeLow incomeLower middle incomeLuxembourgMacao SAR, ChinaMacedonia, FYRMadagascarMalawiMalaysiaMaldivesMaliMaltaMauritaniaMauritiusMexicoMiddle East & North AfricaMiddle East & North Africa (excluding high income)Middle East & North Africa (IDA & IBRD countries)Middle incomeMoldovaMongoliaMoroccoMozambiqueMyanmarNamibiaNepalNetherlandsNew CaledoniaNew ZealandNicaraguaNigerNigeriaNorth AmericaNorwayOECD membersOmanOther small statesPacific island small statesPakistanPalauPanamaPapua New GuineaParaguayPeruPhilippinesPolandPortugalPost-demographic dividendPre-demographic dividendQatarRomaniaRussian FederationRwandaSamoaSao Tome and PrincipeSaudi ArabiaSenegalSerbiaSeychellesSierra LeoneSingaporeSlovak RepublicSloveniaSmall statesSolomon IslandsSomaliaSouth AfricaSouth AsiaSouth Asia (IDA & IBRD)SpainSri LankaSt. Kitts and NevisSt. LuciaSt. Vincent and the GrenadinesSub-Saharan Africa Sub-Saharan Africa (excluding high income)Sub-Saharan Africa (IDA & IBRD countries)SudanSurinameSwazilandSwedenSwitzerlandSyrian Arab RepublicTajikistanTanzaniaThailandTimor-LesteTogoTongaTrinidad and TobagoTunisiaTurkeyTurkmenistanTurks and Caicos IslandsTuvaluUgandaUkraineUnited Arab EmiratesUnited KingdomUnited StatesUpper middle incomeUruguayVanuatuVenezuela, RBVietnamVirgin Islands (U.S.)WorldYemen, Rep.ZambiaZimbabwe Timeline:
This timeline shows a graph from 1963 to 2016 of Japan. No data until 1962. Number of actual observations by date: 54.
Source name:
World Development Indicators
Source organization:
World Bank staff estimates from the Comtrade database maintained by the United Nations Statistics Division.
Categories, topics:
Agriculture & Rural Development, Private Sector, Trade
Last updated:
apr 23, 2017
Indicators value changes by year
Maximum:
23.729
jan 1, 1964
At the date of observation
Value
Absolute change
Change from previous value
jan 1, 1963
23.715
+23.715
0.0%
jan 1, 1964
23.729
+0.014
0.06%
jan 1, 1965
20.741
-2.988
-12.59%
jan 1, 1966
20.366
-0.375
-1.81%
jan 1, 1967
21.293
+0.927
4.55%
jan 1, 1968
19.146
-2.147
-10.08%
jan 1, 1969
19.34
+0.194
1.01%
jan 1, 1970
17.943
-1.397
-7.22%
jan 1, 1971
16.183
-1.76
-9.81%
jan 1, 1972
14.617
-1.567
-9.68%
jan 1, 1973
15.566
+0.95
6.5%
jan 1, 1974
17.104
+1.538
9.88%
jan 1, 1975
10.944
-6.16
-36.02%
jan 1, 1976
8.863
-2.08
-19.01%
jan 1, 1977
10.223
+1.36
15.34%
jan 1, 1978
10.151
-0.072
-0.71%
jan 1, 1979
10.193
+0.041
0.41%
jan 1, 1980
11.154
+0.961
9.43%
jan 1, 1981
8.637
-2.516
-22.56%
jan 1, 1982
6.705
-1.932
-22.37%
jan 1, 1983
7.047
+0.342
5.09%
jan 1, 1984
6.789
-0.258
-3.66%
jan 1, 1985
6.943
+0.154
2.27%
jan 1, 1986
6.682
-0.261
-3.76%
jan 1, 1987
7.442
+0.76
11.38%
jan 1, 1988
8.77
+1.328
17.84%
jan 1, 1989
8.471
-0.299
-3.41%
jan 1, 1990
8.221
-0.25
-2.95%
jan 1, 1991
6.559
-1.662
-20.22%
jan 1, 1992
6.035
-0.524
-7.99%
jan 1, 1993
6.124
+0.089
1.47%
jan 1, 1994
6.659
+0.535
8.73%
jan 1, 1995
6.06
-0.599
-8.99%
jan 1, 1996
5.557
-0.503
-8.3%
jan 1, 1997
4.846
-0.711
-12.8%
jan 1, 1998
4.567
-0.279
-5.75%
jan 1, 1999
3.614
-0.953
-20.87%
jan 1, 2000
3.524
-0.09
-2.49%
jan 1, 2001
3.086
-0.438
-12.42%
jan 1, 2002
2.767
-0.319
-10.34%
jan 1, 2003
2.576
-0.191
-6.91%
jan 1, 2004
2.496
-0.08
-3.09%
jan 1, 2005
2.369
-0.128
-5.12%
jan 1, 2006
1.994
-0.375
-15.82%
jan 1, 2007
1.961
-0.032
-1.63%
jan 1, 2008
1.776
-0.185
-9.45%
jan 1, 2009
1.503
-0.273
-15.39%
jan 1, 2010
1.443
-0.06
-3.97%
jan 1, 2011
1.567
+0.124
8.56%
jan 1, 2012
1.656
+0.089
5.71%
jan 1, 2013
1.379
-0.277
-16.73%
jan 1, 2014
1.431
+0.052
3.74%
jan 1, 2015
1.311
-0.12
-8.4%
jan 1, 2016
1.44
+0.129
9.86%
Ranking of countries by current statistics by years


Comments: