29
/
en
AIzaSyAYiBZKx7MnpbEhh9jyipgxe19OcubqV5w
April 1, 2024
209057
New Zealand
NZL
true
2
1
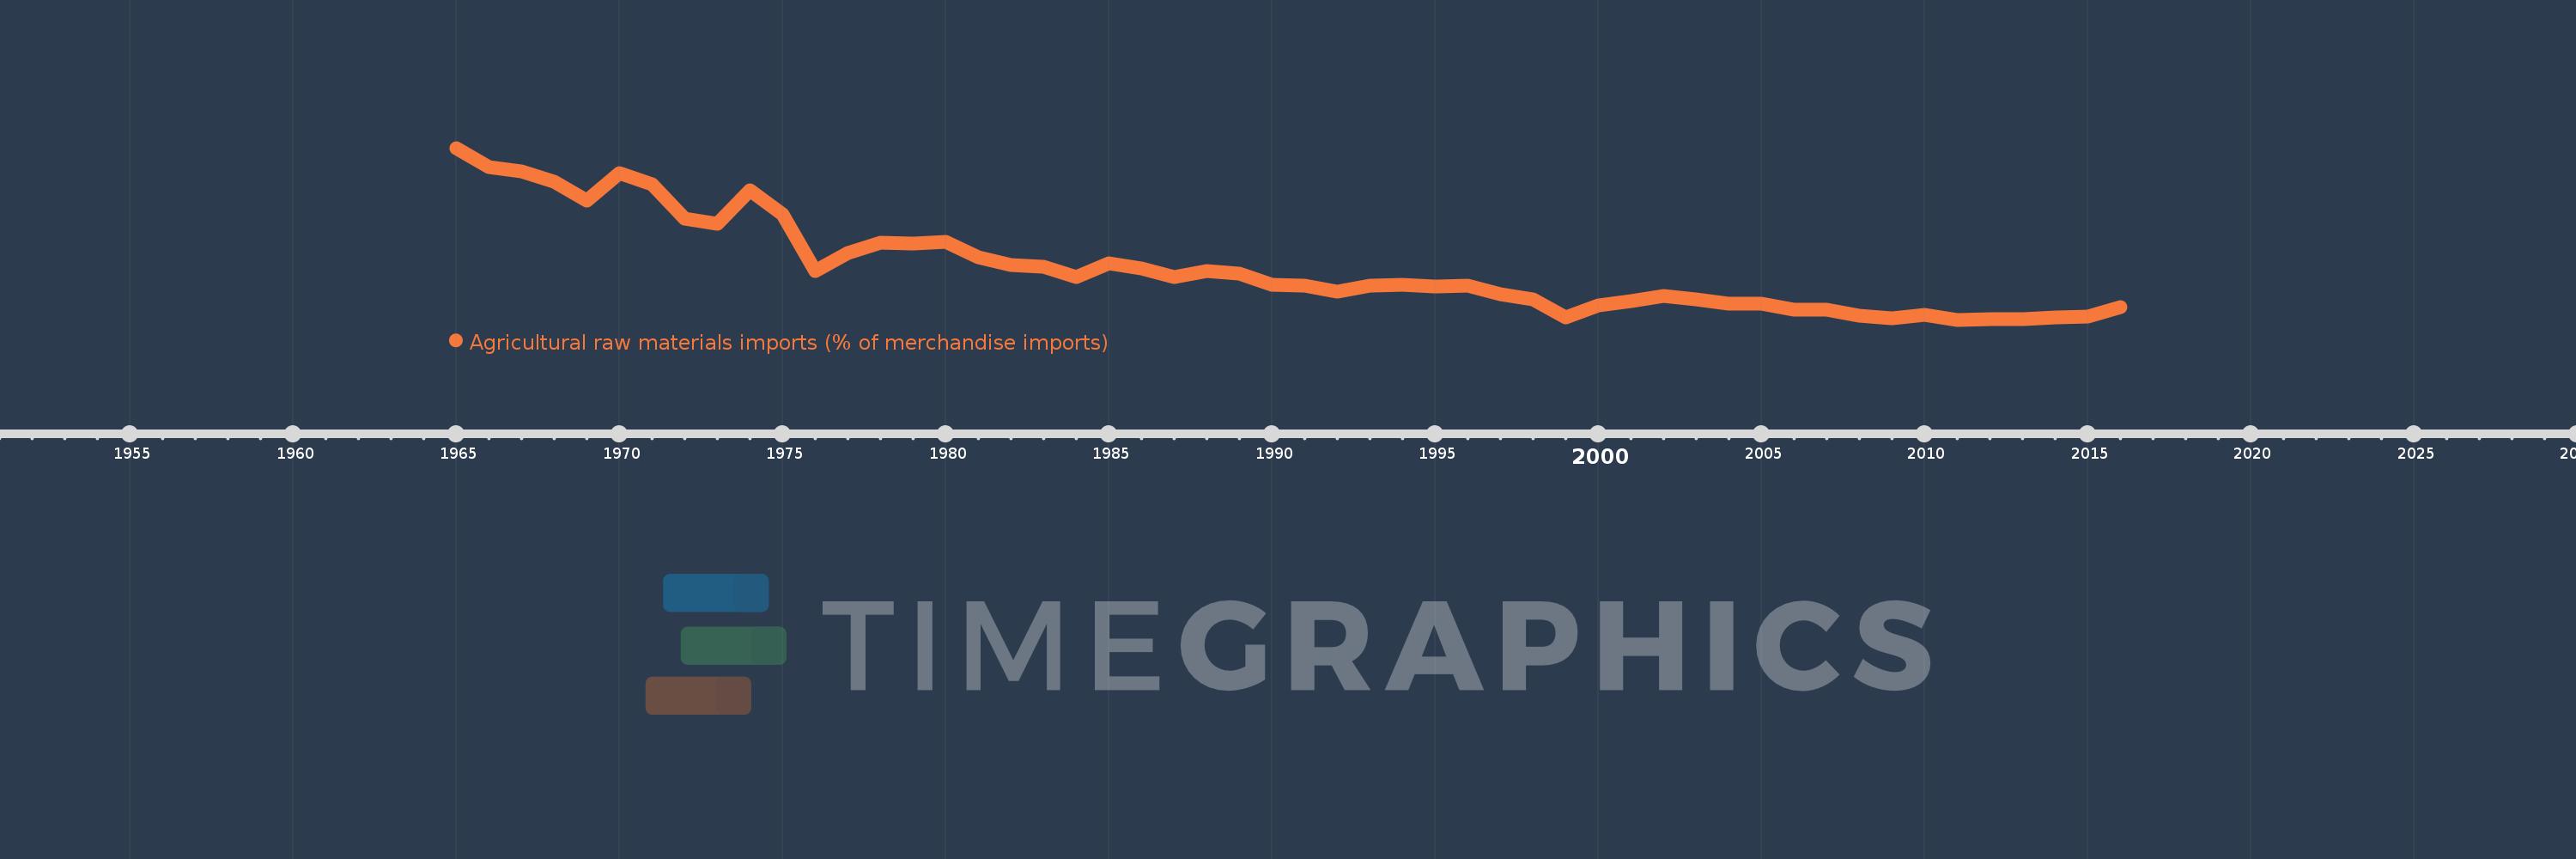
Agricultural raw materials imports (% of merchandise imports)
2016,2015,2014,2013,2012,2011,2010,2009,2008,2007,2006,2005,2004,2003,2002,2001,2000,1999,1998,1997,1996,1995,1994,1993,1992,1991,1990,1989,1988,1987,1986,1985,1984,1983,1982,1981,1980,1979,1978,1977,1976,1975,1974,1973,1972,1971,1970,1969,1968,1967,1966,1965
This statistics in other country:
AfghanistanAlbaniaAlgeriaAndorraAngolaAntigua and BarbudaArab WorldArgentinaArmeniaArubaAustraliaAustriaAzerbaijanBahamas, TheBahrainBangladeshBarbadosBelarusBelgiumBelizeBeninBermudaBhutanBoliviaBosnia and HerzegovinaBotswanaBrazilBrunei DarussalamBulgariaBurkina FasoBurundiCabo VerdeCambodiaCameroonCanadaCaribbean small statesCayman IslandsCentral African RepublicCentral Europe and the BalticsChadChileChinaColombiaComorosCongo, Dem. Rep.Congo, Rep.Costa RicaCote d'IvoireCroatiaCubaCyprusCzech RepublicDenmarkDjiboutiDominicaDominican RepublicEarly-demographic dividendEast Asia & PacificEast Asia & Pacific (excluding high income)East Asia & Pacific (IDA & IBRD countries)EcuadorEgypt, Arab Rep.El SalvadorEquatorial GuineaEritreaEstoniaEthiopiaEuro areaEurope & Central AsiaEurope & Central Asia (excluding high income)Europe & Central Asia (IDA & IBRD countries)European UnionFaroe IslandsFijiFinlandFragile and conflict affected situationsFranceFrench PolynesiaGabonGambia, TheGeorgiaGermanyGhanaGreeceGreenlandGrenadaGuatemalaGuineaGuinea-BissauGuyanaHaitiHeavily indebted poor countries (HIPC)High incomeHondurasHong Kong SAR, ChinaHungaryIBRD onlyIcelandIDA & IBRD totalIDA blendIDA onlyIDA totalIndiaIndonesiaIran, Islamic Rep.IraqIrelandIsraelItalyJamaicaJapanJordanKazakhstanKenyaKiribatiKorea, Rep.KuwaitKyrgyz RepublicLao PDRLate-demographic dividendLatin America & Caribbean Latin America & Caribbean (excluding high income)Latin America & the Caribbean (IDA & IBRD countries)LatviaLeast developed countries: UN classificationLebanonLesothoLiberiaLibyaLithuaniaLow & middle incomeLow incomeLower middle incomeLuxembourgMacao SAR, ChinaMacedonia, FYRMadagascarMalawiMalaysiaMaldivesMaliMaltaMauritaniaMauritiusMexicoMiddle East & North AfricaMiddle East & North Africa (excluding high income)Middle East & North Africa (IDA & IBRD countries)Middle incomeMoldovaMongoliaMoroccoMozambiqueMyanmarNamibiaNepalNetherlandsNew CaledoniaNew ZealandNicaraguaNigerNigeriaNorth AmericaNorwayOECD membersOmanOther small statesPacific island small statesPakistanPalauPanamaPapua New GuineaParaguayPeruPhilippinesPolandPortugalPost-demographic dividendPre-demographic dividendQatarRomaniaRussian FederationRwandaSamoaSao Tome and PrincipeSaudi ArabiaSenegalSerbiaSeychellesSierra LeoneSingaporeSlovak RepublicSloveniaSmall statesSolomon IslandsSomaliaSouth AfricaSouth AsiaSouth Asia (IDA & IBRD)SpainSri LankaSt. Kitts and NevisSt. LuciaSt. Vincent and the GrenadinesSub-Saharan Africa Sub-Saharan Africa (excluding high income)Sub-Saharan Africa (IDA & IBRD countries)SudanSurinameSwazilandSwedenSwitzerlandSyrian Arab RepublicTajikistanTanzaniaThailandTimor-LesteTogoTongaTrinidad and TobagoTunisiaTurkeyTurkmenistanTurks and Caicos IslandsTuvaluUgandaUkraineUnited Arab EmiratesUnited KingdomUnited StatesUpper middle incomeUruguayVanuatuVenezuela, RBVietnamVirgin Islands (U.S.)WorldYemen, Rep.ZambiaZimbabwe Timeline:
This timeline shows a graph from 1965 to 2016 of New Zealand. No data until 1964. Number of actual observations by date: 52.
Source name:
World Development Indicators
Source organization:
World Bank staff estimates from the Comtrade database maintained by the United Nations Statistics Division.
Categories, topics:
Agriculture & Rural Development, Private Sector, Trade
Last updated:
apr 23, 2017
Indicators value changes by year
At the date of observation
Value
Absolute change
Change from previous value
jan 1, 1965
3.528
+3.528
0.0%
jan 1, 1966
3.196
-0.331
-9.4%
jan 1, 1967
3.129
-0.068
-2.12%
jan 1, 1968
2.954
-0.175
-5.59%
jan 1, 1969
2.64
-0.314
-10.62%
jan 1, 1970
3.098
+0.458
17.33%
jan 1, 1971
2.918
-0.18
-5.81%
jan 1, 1972
2.321
-0.597
-20.47%
jan 1, 1973
2.238
-0.082
-3.55%
jan 1, 1974
2.807
+0.568
25.39%
jan 1, 1975
2.401
-0.406
-14.46%
jan 1, 1976
1.436
-0.965
-40.2%
jan 1, 1977
1.738
+0.302
21.07%
jan 1, 1978
1.924
+0.186
10.68%
jan 1, 1979
1.898
-0.026
-1.34%
jan 1, 1980
1.936
+0.038
2.02%
jan 1, 1981
1.668
-0.268
-13.86%
jan 1, 1982
1.536
-0.132
-7.89%
jan 1, 1983
1.505
-0.032
-2.08%
jan 1, 1984
1.339
-0.165
-10.97%
jan 1, 1985
1.575
+0.235
17.58%
jan 1, 1986
1.486
-0.089
-5.65%
jan 1, 1987
1.334
-0.152
-10.24%
jan 1, 1988
1.44
+0.106
7.95%
jan 1, 1989
1.395
-0.045
-3.12%
jan 1, 1990
1.2
-0.195
-13.99%
jan 1, 1991
1.195
-0.005
-0.43%
jan 1, 1992
1.086
-0.109
-9.13%
jan 1, 1993
1.19
+0.104
9.59%
jan 1, 1994
1.211
+0.022
1.81%
jan 1, 1995
1.181
-0.03
-2.48%
jan 1, 1996
1.196
+0.015
1.24%
jan 1, 1997
1.039
-0.157
-13.13%
jan 1, 1998
0.955
-0.084
-8.09%
jan 1, 1999
0.653
-0.302
-31.61%
jan 1, 2000
0.848
+0.195
29.9%
jan 1, 2001
0.934
+0.086
10.17%
jan 1, 2002
1.015
+0.081
8.65%
jan 1, 2003
0.96
-0.055
-5.43%
jan 1, 2004
0.886
-0.074
-7.72%
jan 1, 2005
0.891
+0.005
0.53%
jan 1, 2006
0.786
-0.105
-11.77%
jan 1, 2007
0.782
-0.004
-0.49%
jan 1, 2008
0.684
-0.098
-12.53%
jan 1, 2009
0.632
-0.052
-7.62%
jan 1, 2010
0.687
+0.055
8.67%
jan 1, 2011
0.611
-0.076
-11.08%
jan 1, 2012
0.619
+0.008
1.32%
jan 1, 2013
0.621
+0.003
0.43%
jan 1, 2014
0.656
+0.034
5.53%
jan 1, 2015
0.67
+0.015
2.24%
jan 1, 2016
0.829
+0.159
23.7%
Ranking of countries by current statistics by years


Comments: