29
/
en
AIzaSyAYiBZKx7MnpbEhh9jyipgxe19OcubqV5w
April 1, 2024
72657
Australia
AUS
true
2
1
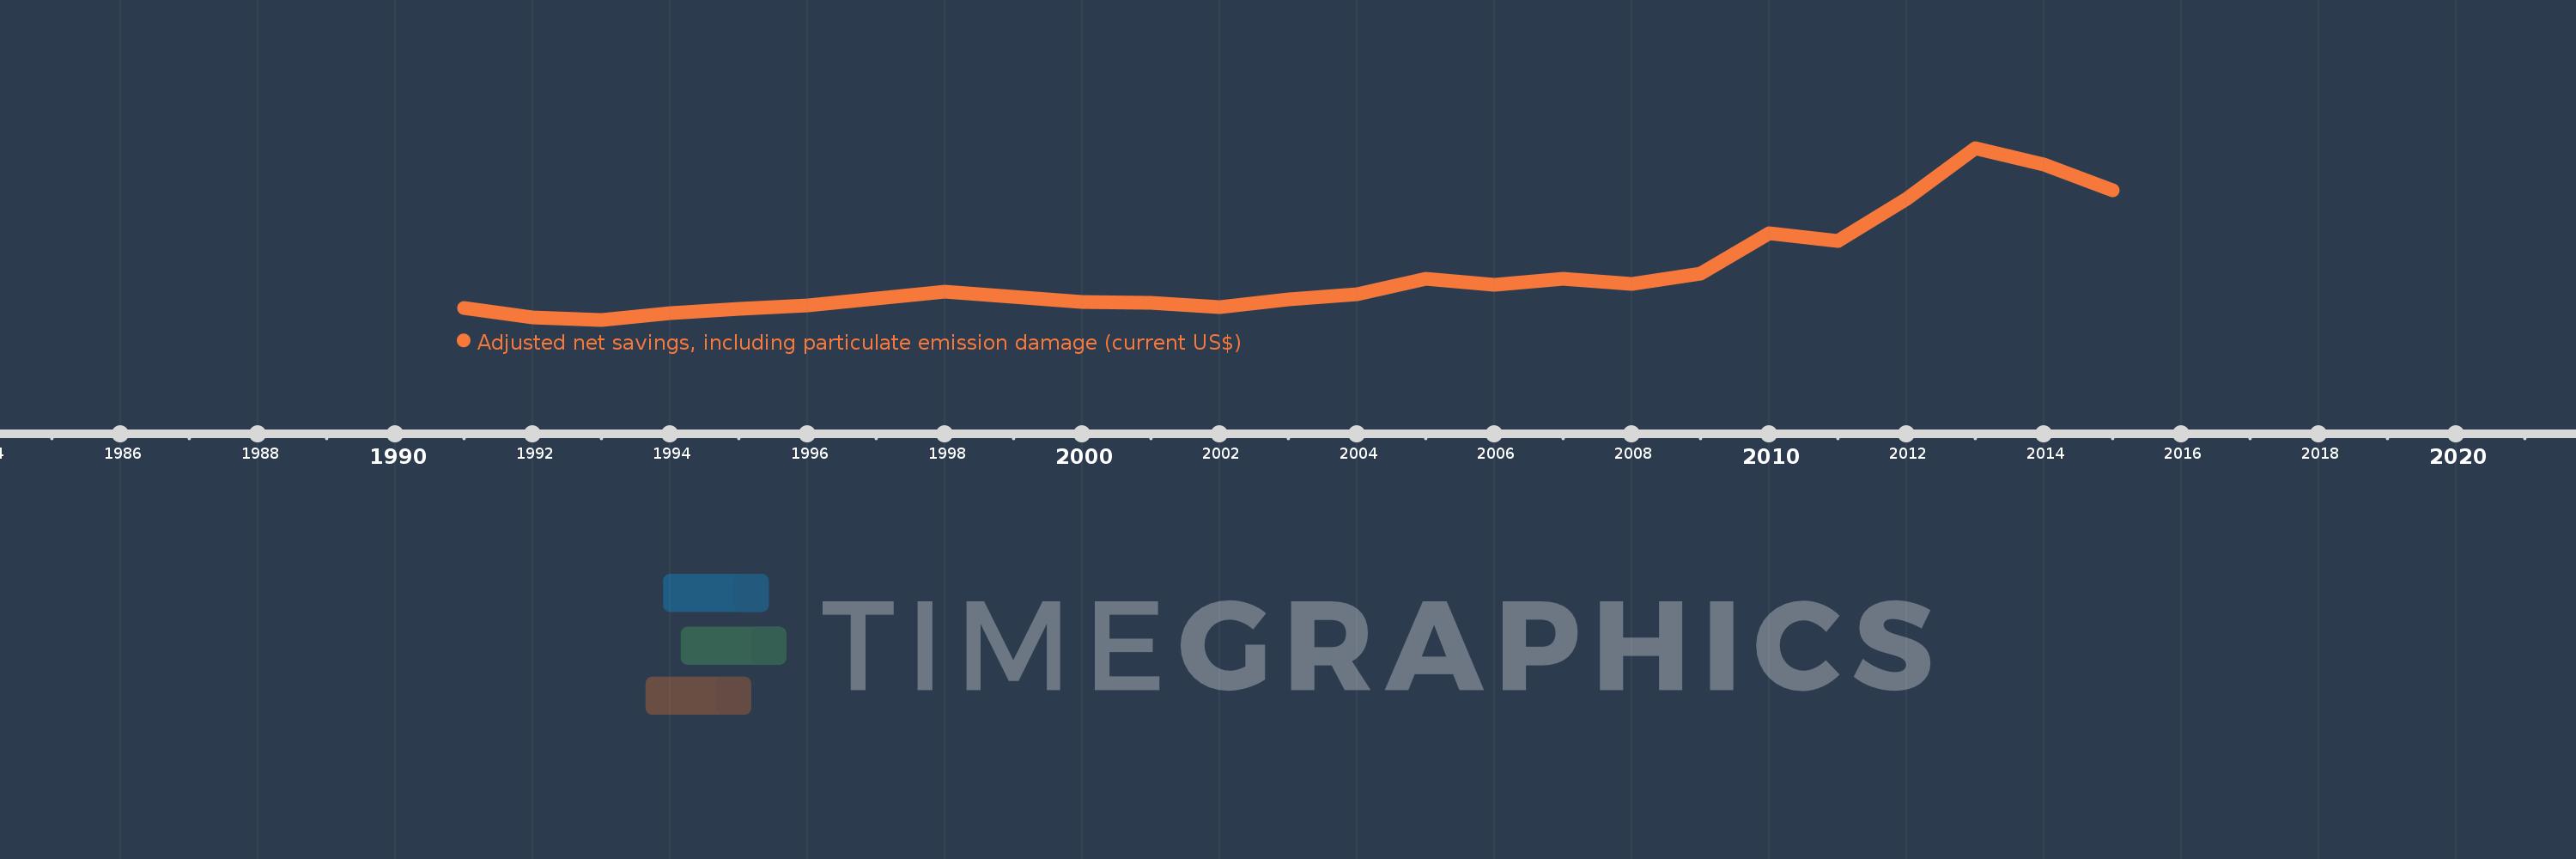
Adjusted net savings, including particulate emission damage (current US$)
2015,2014,2013,2012,2011,2010,2009,2008,2007,2006,2005,2004,2003,2002,2001,2000,1999,1998,1997,1996,1995,1994,1993,1992,1991
This statistics in other country:
AfghanistanAlbaniaAlgeriaAngolaArgentinaArmeniaAustraliaAustriaAzerbaijanBahamas, TheBahrainBangladeshBarbadosBelarusBelgiumBelizeBeninBhutanBoliviaBotswanaBrazilBrunei DarussalamBulgariaBurkina FasoBurundiCabo VerdeCambodiaCameroonCanadaCentral African RepublicChadChileChinaColombiaComorosCongo, Dem. Rep.Congo, Rep.Costa RicaCote d'IvoireCroatiaCyprusCzech RepublicDenmarkDominican RepublicEcuadorEgypt, Arab Rep.El SalvadorEquatorial GuineaEritreaEstoniaEthiopiaFijiFinlandFranceGabonGambia, TheGeorgiaGermanyGhanaGreeceGuatemalaGuineaGuinea-BissauGuyanaHaitiHondurasHungaryIcelandIndiaIndonesiaIran, Islamic Rep.IraqIrelandIsraelItalyJamaicaJapanJordanKazakhstanKenyaKorea, Rep.KuwaitKyrgyz RepublicLao PDRLatviaLebanonLesothoLiberiaLibyaLithuaniaLuxembourgMacedonia, FYRMadagascarMalawiMalaysiaMaldivesMaliMauritaniaMauritiusMexicoMoldovaMongoliaMoroccoMozambiqueNamibiaNepalNetherlandsNew ZealandNicaraguaNigerNigeriaNorwayOmanPakistanPanamaPapua New GuineaParaguayPeruPhilippinesPolandPortugalQatarRomaniaRussian FederationRwandaSaudi ArabiaSenegalSierra LeoneSingaporeSlovak RepublicSloveniaSolomon IslandsSouth AfricaSpainSri LankaSudanSurinameSwazilandSwedenSwitzerlandSyrian Arab RepublicTajikistanTanzaniaThailandTogoTrinidad and TobagoTunisiaTurkeyUgandaUkraineUnited KingdomUnited StatesUruguayVenezuela, RBVietnamYemen, Rep.ZambiaZimbabwe Timeline:
This timeline shows a graph from 1991 to 2015 of Australia. No data until 1990. Number of actual observations by date: 25.
Source name:
World Development Indicators
Source organization:
World Bank staff estimates based on sources and methods in World Bank's "The Changing Wealth of Nations: Measuring Sustainable Development in the New Millennium" (2011).
Categories, topics:
Economy & Growth, Environment
Last updated:
apr 23, 2017
Indicators value changes by year
Minimum:
14.86 bln
jan 1, 1993
Maximum:
154.147 bln
jan 1, 2013
At the date of observation
Value
Absolute change
Change from previous value
jan 1, 1991
24.419 bln
+24.419 bln
0.0%
jan 1, 1992
17.035 bln
-7.385 bln
-30.24%
jan 1, 1993
14.86 bln
-2.174 bln
-12.76%
jan 1, 1994
20.292 bln
+5.432 bln
36.55%
jan 1, 1995
23.602 bln
+3.31 bln
16.31%
jan 1, 1996
26.743 bln
+3.141 bln
13.31%
jan 1, 1997
32.404 bln
+5.661 bln
21.17%
jan 1, 1998
37.654 bln
+5.25 bln
16.2%
jan 1, 1999
33.482 bln
-4.173 bln
-11.08%
jan 1, 2000
29.472 bln
-4.01 bln
-11.98%
jan 1, 2001
28.414 bln
-1.058 bln
-3.59%
jan 1, 2002
25.372 bln
-3.041 bln
-10.7%
jan 1, 2003
31.485 bln
+6.113 bln
24.09%
jan 1, 2004
35.311 bln
+3.826 bln
12.15%
jan 1, 2005
47.742 bln
+12.43 bln
35.2%
jan 1, 2006
43.439 bln
-4.302 bln
-9.01%
jan 1, 2007
47.81 bln
+4.371 bln
10.06%
jan 1, 2008
43.982 bln
-3.828 bln
-8.01%
jan 1, 2009
52.091 bln
+8.11 bln
18.44%
jan 1, 2010
85.072 bln
+32.98 bln
63.31%
jan 1, 2011
78.725 bln
-6.347 bln
-7.46%
jan 1, 2012
112.598 bln
+33.873 bln
43.03%
jan 1, 2013
154.147 bln
+41.549 bln
36.9%
jan 1, 2014
140.473 bln
-13.674 bln
-8.87%
jan 1, 2015
120.09 bln
-20.382 bln
-14.51%
Ranking of countries by current statistics by years


Comments: