29
/
en
AIzaSyAYiBZKx7MnpbEhh9jyipgxe19OcubqV5w
April 1, 2024
193841
Mauritius
MUS
true
2
1
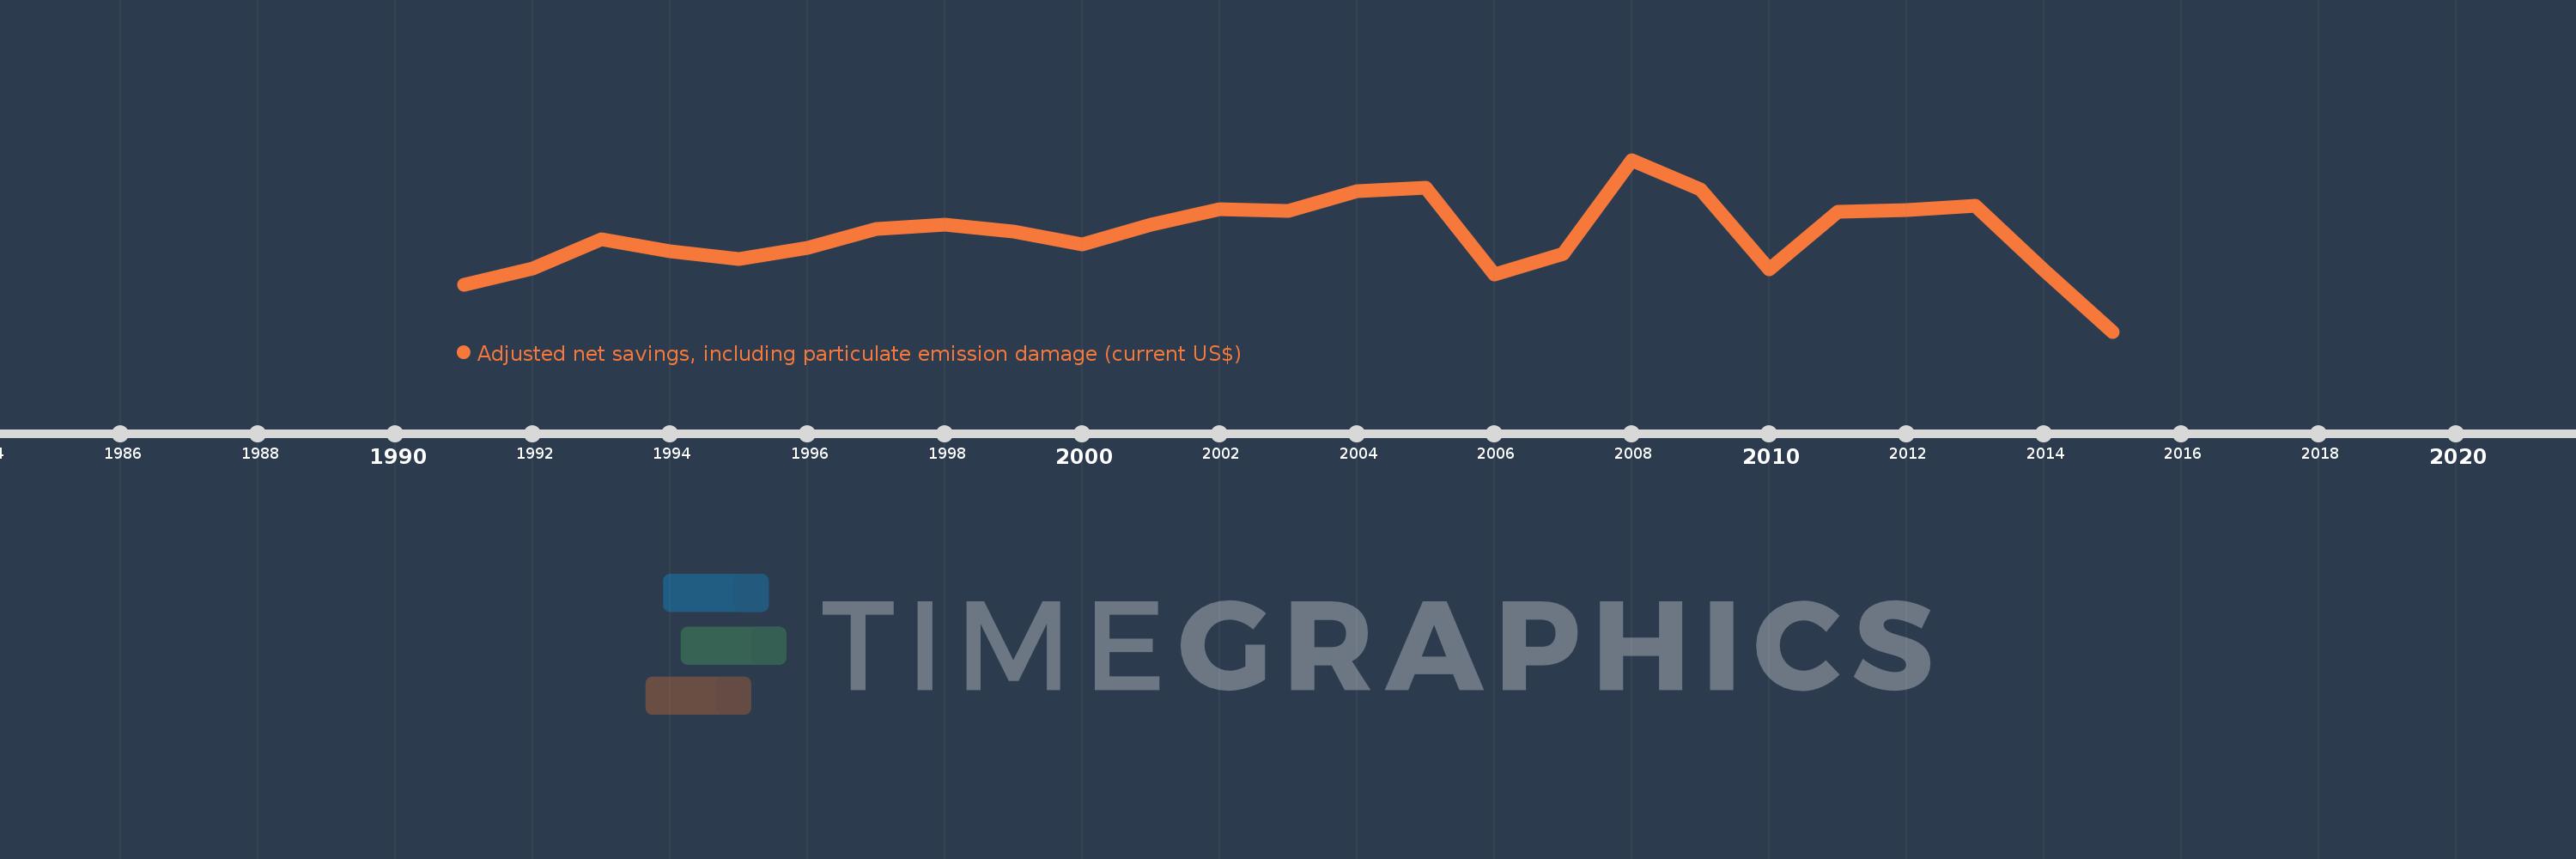
Adjusted net savings, including particulate emission damage (current US$)
2015,2014,2013,2012,2011,2010,2009,2008,2007,2006,2005,2004,2003,2002,2001,2000,1999,1998,1997,1996,1995,1994,1993,1992,1991
This statistics in other country:
AfghanistanAlbaniaAlgeriaAngolaArgentinaArmeniaAustraliaAustriaAzerbaijanBahamas, TheBahrainBangladeshBarbadosBelarusBelgiumBelizeBeninBhutanBoliviaBotswanaBrazilBrunei DarussalamBulgariaBurkina FasoBurundiCabo VerdeCambodiaCameroonCanadaCentral African RepublicChadChileChinaColombiaComorosCongo, Dem. Rep.Congo, Rep.Costa RicaCote d'IvoireCroatiaCyprusCzech RepublicDenmarkDominican RepublicEcuadorEgypt, Arab Rep.El SalvadorEquatorial GuineaEritreaEstoniaEthiopiaFijiFinlandFranceGabonGambia, TheGeorgiaGermanyGhanaGreeceGuatemalaGuineaGuinea-BissauGuyanaHaitiHondurasHungaryIcelandIndiaIndonesiaIran, Islamic Rep.IraqIrelandIsraelItalyJamaicaJapanJordanKazakhstanKenyaKorea, Rep.KuwaitKyrgyz RepublicLao PDRLatviaLebanonLesothoLiberiaLibyaLithuaniaLuxembourgMacedonia, FYRMadagascarMalawiMalaysiaMaldivesMaliMauritaniaMauritiusMexicoMoldovaMongoliaMoroccoMozambiqueNamibiaNepalNetherlandsNew ZealandNicaraguaNigerNigeriaNorwayOmanPakistanPanamaPapua New GuineaParaguayPeruPhilippinesPolandPortugalQatarRomaniaRussian FederationRwandaSaudi ArabiaSenegalSierra LeoneSingaporeSlovak RepublicSloveniaSolomon IslandsSouth AfricaSpainSri LankaSudanSurinameSwazilandSwedenSwitzerlandSyrian Arab RepublicTajikistanTanzaniaThailandTogoTrinidad and TobagoTunisiaTurkeyUgandaUkraineUnited KingdomUnited StatesUruguayVenezuela, RBVietnamYemen, Rep.ZambiaZimbabwe Timeline:
This timeline shows a graph from 1991 to 2015 of Mauritius. No data until 1990. Number of actual observations by date: 25.
Source name:
World Development Indicators
Source organization:
World Bank staff estimates based on sources and methods in World Bank's "The Changing Wealth of Nations: Measuring Sustainable Development in the New Millennium" (2011).
Categories, topics:
Economy & Growth, Environment
Last updated:
apr 23, 2017
Indicators value changes by year
Minimum:
330.221 mln
jan 1, 2015
Maximum:
1.048 bln
jan 1, 2008
At the date of observation
Value
Absolute change
Change from previous value
jan 1, 1991
526.342 mln
+526.342 mln
0.0%
jan 1, 1992
593.962 mln
+67.62 mln
12.85%
jan 1, 1993
716.169 mln
+122.207 mln
20.57%
jan 1, 1994
666.083 mln
-50.086 mln
-6.99%
jan 1, 1995
633.659 mln
-32.424 mln
-4.87%
jan 1, 1996
681.914 mln
+48.255 mln
7.62%
jan 1, 1997
760.131 mln
+78.217 mln
11.47%
jan 1, 1998
777.416 mln
+17.285 mln
2.27%
jan 1, 1999
748.81 mln
-28.606 mln
-3.68%
jan 1, 2000
693.879 mln
-54.93 mln
-7.34%
jan 1, 2001
777.33 mln
+83.45 mln
12.03%
jan 1, 2002
843.24 mln
+65.91 mln
8.48%
jan 1, 2003
835.902 mln
-7.338 mln
-0.87%
jan 1, 2004
916.815 mln
+80.913 mln
9.68%
jan 1, 2005
931.397 mln
+14.583 mln
1.59%
jan 1, 2006
570.438 mln
-360.959 mln
-38.75%
jan 1, 2007
653.516 mln
+83.078 mln
14.56%
jan 1, 2008
1.048 bln
+394.682 mln
60.39%
jan 1, 2009
924.685 mln
-123.514 mln
-11.78%
jan 1, 2010
591.787 mln
-332.898 mln
-36.0%
jan 1, 2011
831.133 mln
+239.346 mln
40.44%
jan 1, 2012
836.884 mln
+5.751 mln
0.69%
jan 1, 2013
855.662 mln
+18.778 mln
2.24%
jan 1, 2014
586.358 mln
-269.304 mln
-31.47%
jan 1, 2015
330.221 mln
-256.137 mln
-43.68%
Ranking of countries by current statistics by years


Comments: