29
/
en
AIzaSyAYiBZKx7MnpbEhh9jyipgxe19OcubqV5w
April 1, 2024
118600
Denmark
DNK
true
2
1
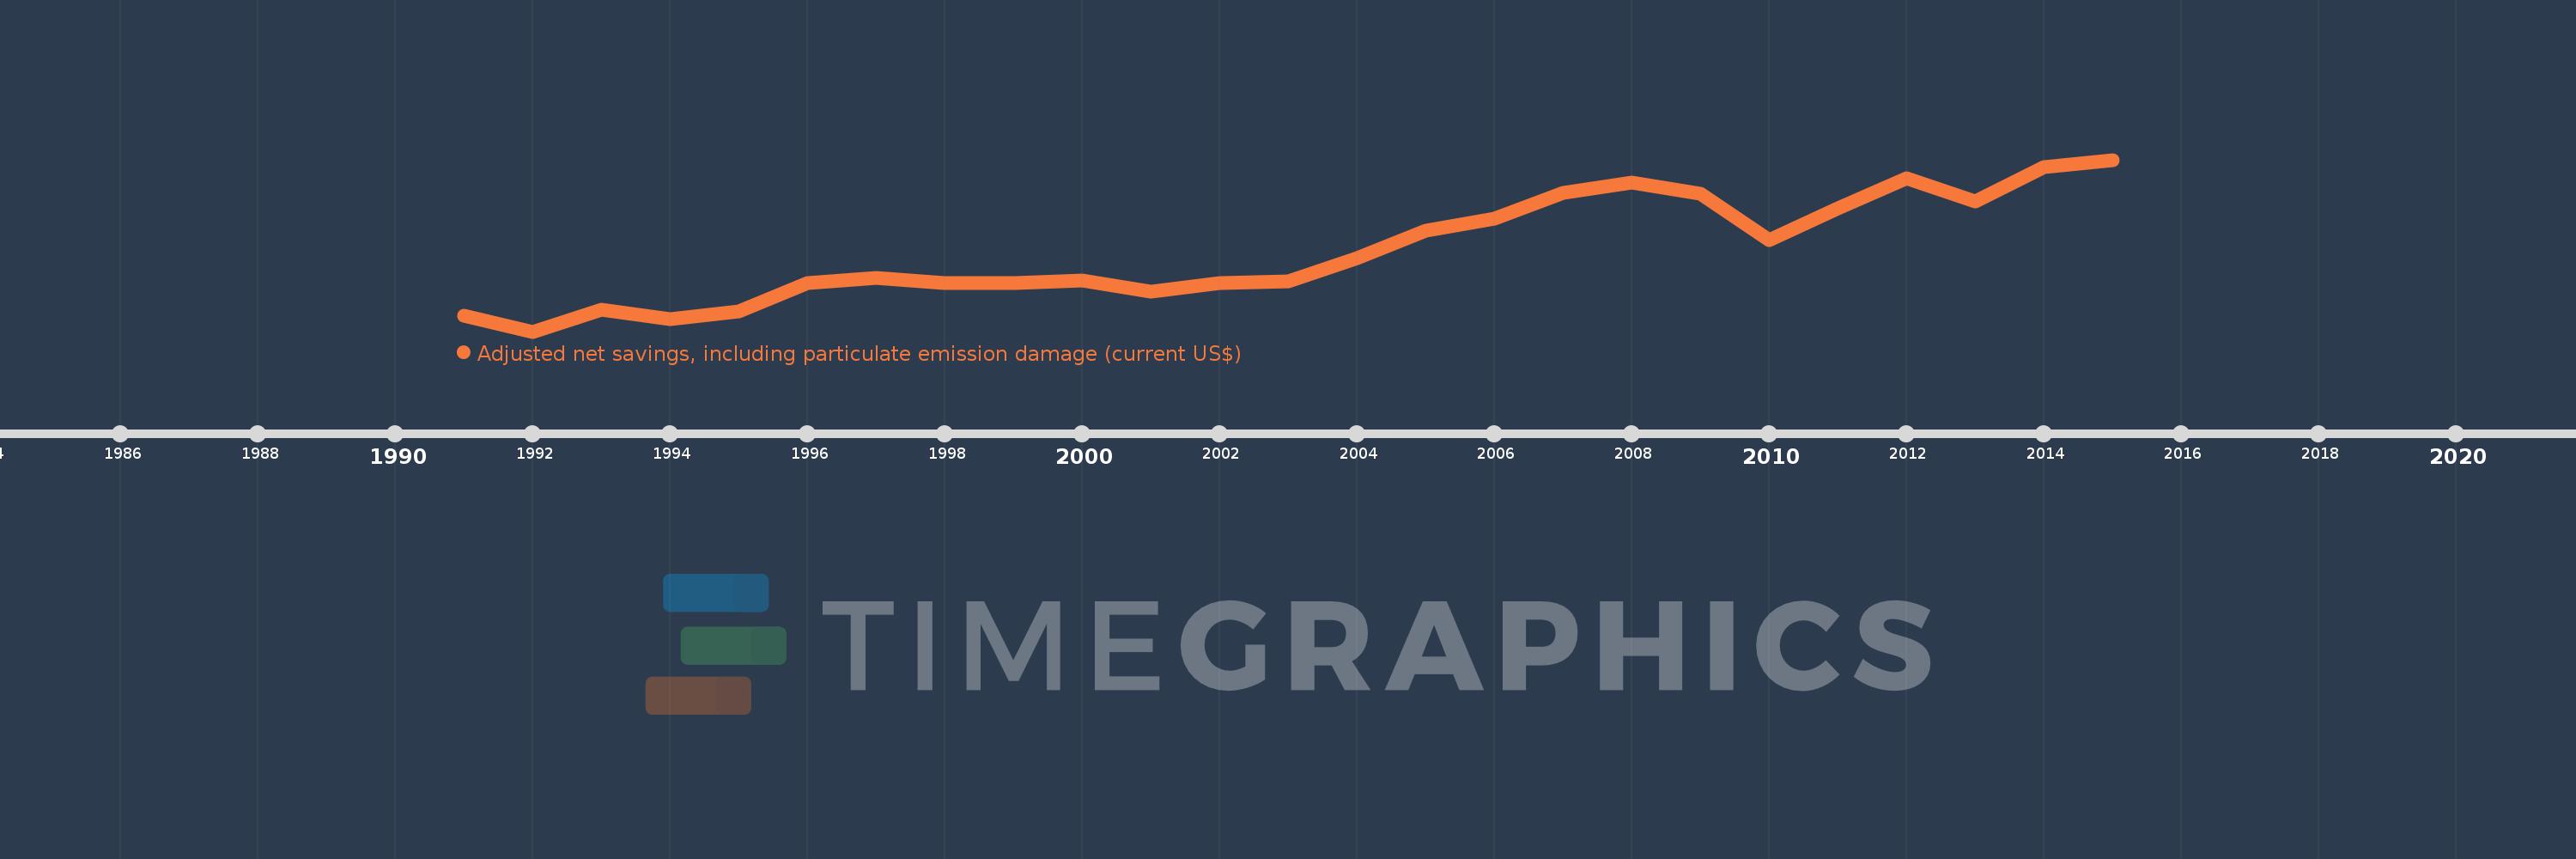
Adjusted net savings, including particulate emission damage (current US$)
2015,2014,2013,2012,2011,2010,2009,2008,2007,2006,2005,2004,2003,2002,2001,2000,1999,1998,1997,1996,1995,1994,1993,1992,1991
This statistics in other country:
AfghanistanAlbaniaAlgeriaAngolaArgentinaArmeniaAustraliaAustriaAzerbaijanBahamas, TheBahrainBangladeshBarbadosBelarusBelgiumBelizeBeninBhutanBoliviaBotswanaBrazilBrunei DarussalamBulgariaBurkina FasoBurundiCabo VerdeCambodiaCameroonCanadaCentral African RepublicChadChileChinaColombiaComorosCongo, Dem. Rep.Congo, Rep.Costa RicaCote d'IvoireCroatiaCyprusCzech RepublicDenmarkDominican RepublicEcuadorEgypt, Arab Rep.El SalvadorEquatorial GuineaEritreaEstoniaEthiopiaFijiFinlandFranceGabonGambia, TheGeorgiaGermanyGhanaGreeceGuatemalaGuineaGuinea-BissauGuyanaHaitiHondurasHungaryIcelandIndiaIndonesiaIran, Islamic Rep.IraqIrelandIsraelItalyJamaicaJapanJordanKazakhstanKenyaKorea, Rep.KuwaitKyrgyz RepublicLao PDRLatviaLebanonLesothoLiberiaLibyaLithuaniaLuxembourgMacedonia, FYRMadagascarMalawiMalaysiaMaldivesMaliMauritaniaMauritiusMexicoMoldovaMongoliaMoroccoMozambiqueNamibiaNepalNetherlandsNew ZealandNicaraguaNigerNigeriaNorwayOmanPakistanPanamaPapua New GuineaParaguayPeruPhilippinesPolandPortugalQatarRomaniaRussian FederationRwandaSaudi ArabiaSenegalSierra LeoneSingaporeSlovak RepublicSloveniaSolomon IslandsSouth AfricaSpainSri LankaSudanSurinameSwazilandSwedenSwitzerlandSyrian Arab RepublicTajikistanTanzaniaThailandTogoTrinidad and TobagoTunisiaTurkeyUgandaUkraineUnited KingdomUnited StatesUruguayVenezuela, RBVietnamYemen, Rep.ZambiaZimbabwe Timeline:
This timeline shows a graph from 1991 to 2015 of Denmark. No data until 1990. Number of actual observations by date: 25.
Source name:
World Development Indicators
Source organization:
World Bank staff estimates based on sources and methods in World Bank's "The Changing Wealth of Nations: Measuring Sustainable Development in the New Millennium" (2011).
Categories, topics:
Economy & Growth, Environment
Last updated:
apr 23, 2017
Indicators value changes by year
Minimum:
14.349 bln
jan 1, 1992
Maximum:
51.063 bln
jan 1, 2015
At the date of observation
Value
Absolute change
Change from previous value
jan 1, 1991
17.828 bln
+17.828 bln
0.0%
jan 1, 1992
14.349 bln
-3.479 bln
-19.51%
jan 1, 1993
19.042 bln
+4.693 bln
32.71%
jan 1, 1994
17.098 bln
-1.944 bln
-10.21%
jan 1, 1995
18.665 bln
+1.567 bln
9.17%
jan 1, 1996
24.714 bln
+6.049 bln
32.41%
jan 1, 1997
25.76 bln
+1.045 bln
4.23%
jan 1, 1998
24.648 bln
-1.112 bln
-4.32%
jan 1, 1999
24.711 bln
+63.44 mln
0.26%
jan 1, 2000
25.182 bln
+470.716 mln
1.9%
jan 1, 2001
22.934 bln
-2.248 bln
-8.93%
jan 1, 2002
24.637 bln
+1.703 bln
7.43%
jan 1, 2003
25.153 bln
+515.515 mln
2.09%
jan 1, 2004
30.039 bln
+4.886 bln
19.43%
jan 1, 2005
35.857 bln
+5.818 bln
19.37%
jan 1, 2006
38.552 bln
+2.694 bln
7.51%
jan 1, 2007
44.0 bln
+5.448 bln
14.13%
jan 1, 2008
46.129 bln
+2.129 bln
4.84%
jan 1, 2009
43.854 bln
-2.275 bln
-4.93%
jan 1, 2010
33.839 bln
-10.015 bln
-22.84%
jan 1, 2011
40.735 bln
+6.896 bln
20.38%
jan 1, 2012
47.158 bln
+6.422 bln
15.77%
jan 1, 2013
42.185 bln
-4.973 bln
-10.54%
jan 1, 2014
49.565 bln
+7.38 bln
17.49%
jan 1, 2015
51.063 bln
+1.498 bln
3.02%
Ranking of countries by current statistics by years


Comments: