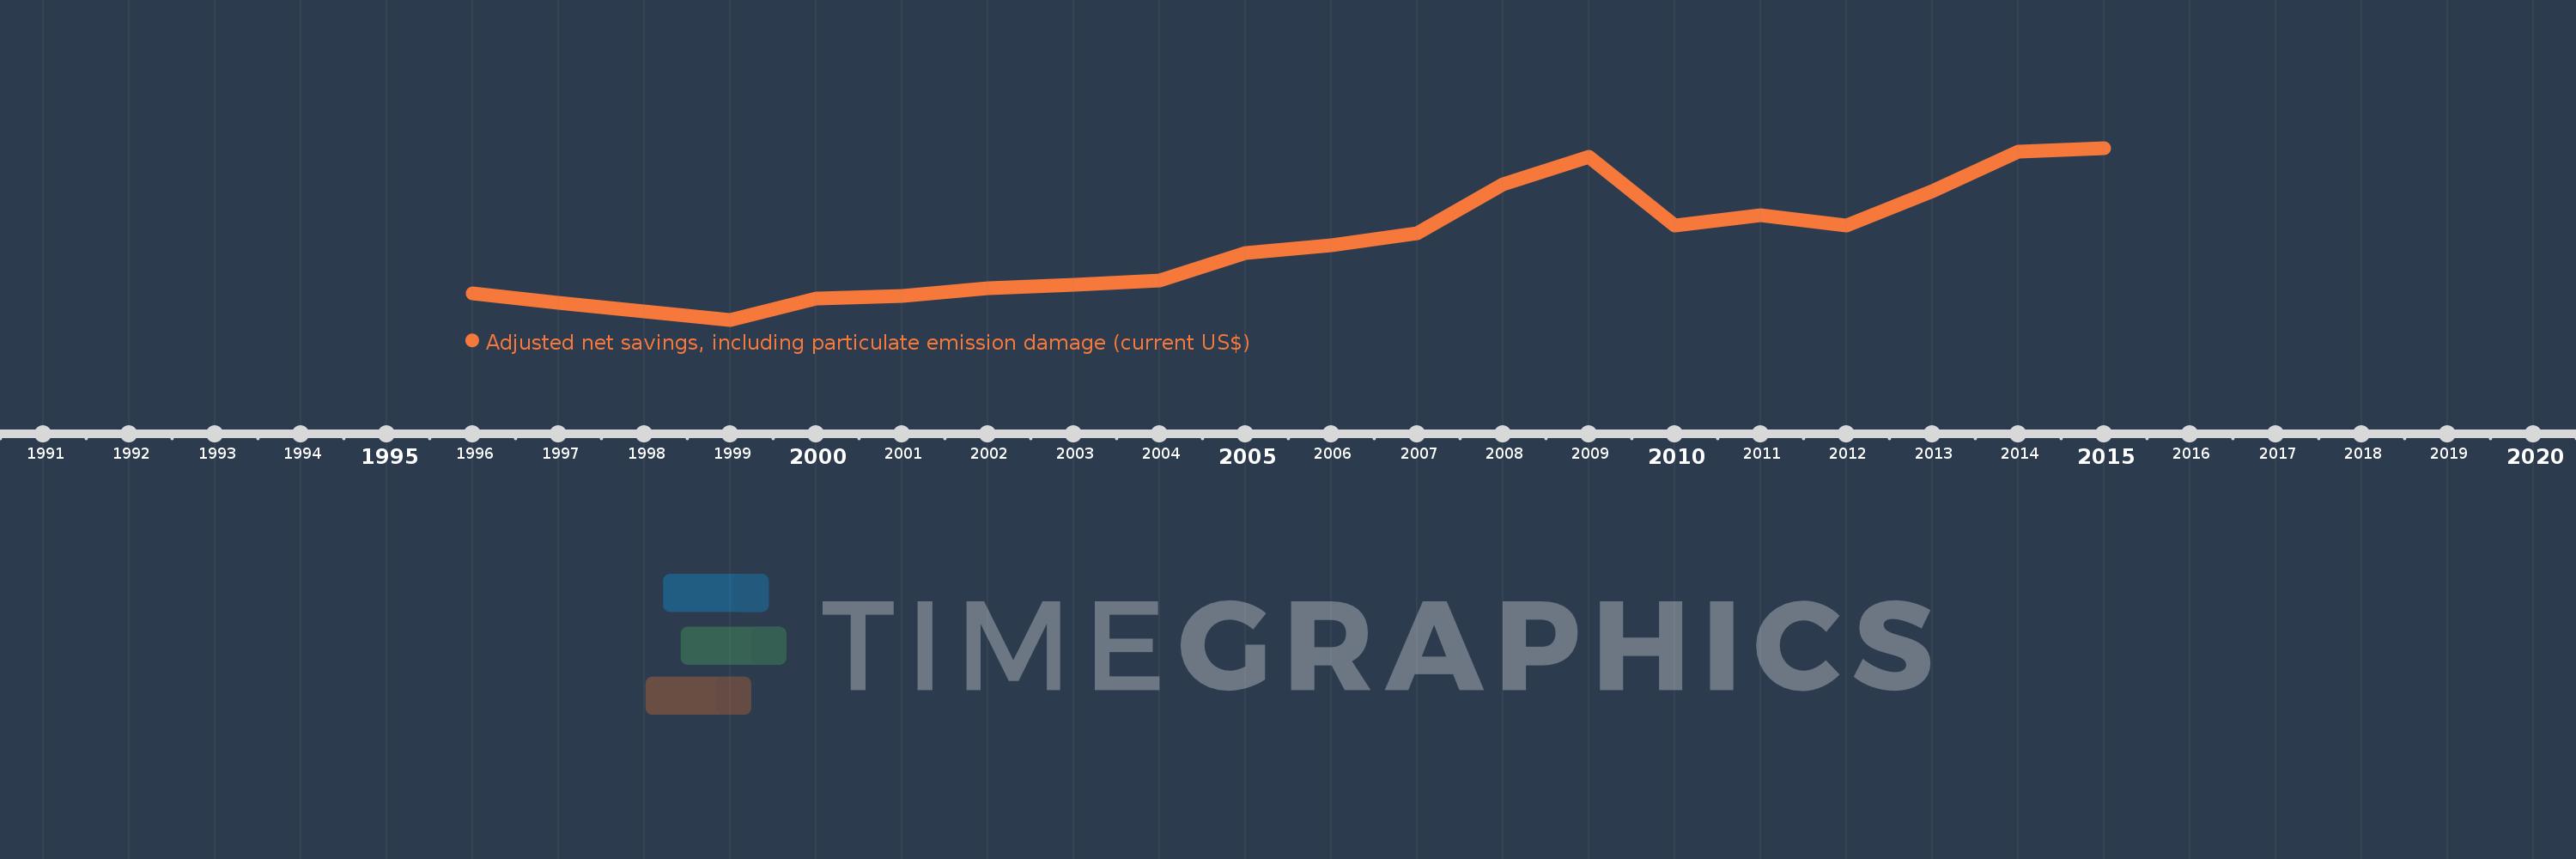
This timeline shows a graph from 1996 to 2015 of Moldova. No data until 1995. Number of actual observations by date: 20.
Source name:
World Development Indicators
Source organization:
World Bank staff estimates based on sources and methods in World Bank's "The Changing Wealth of Nations: Measuring Sustainable Development in the New Millennium" (2011).
Categories, topics:
Economy & Growth, Environment
Last updated:
apr 23, 2017
Indicators value changes by year
Meaning:
411.924 mln
Minimum:
-200.402 mln
jan 1, 1999
Maximum:
1.212 bln
jan 1, 2015
At the date of observation
Value
Absolute change
Change from the previous value
jan 1, 1996
14.73 mln
+14.73 mln
0.0%
jan 1, 1997
-62.41 mln
-77.139 mln
-523.7%
jan 1, 1998
-132.948 mln
-70.539 mln
113.03%
jan 1, 1999
-200.402 mln
-67.454 mln
50.74%
jan 1, 2000
-23.607 mln
+176.795 mln
-88.22%
jan 1, 2001
-7.0 mln
+16.607 mln
-70.35%
jan 1, 2002
58.251 mln
+65.251 mln
-932.19%
jan 1, 2003
86.237 mln
+27.986 mln
48.04%
jan 1, 2004
120.287 mln
+34.05 mln
39.48%
jan 1, 2005
348.134 mln
+227.847 mln
189.42%
jan 1, 2006
414.674 mln
+66.54 mln
19.11%
jan 1, 2007
509.227 mln
+94.553 mln
22.8%
jan 1, 2008
910.764 mln
+401.537 mln
78.85%
jan 1, 2009
1.139 bln
+227.782 mln
25.01%
jan 1, 2010
577.432 mln
-561.114 mln
-49.28%
jan 1, 2011
659.892 mln
+82.46 mln
14.28%
jan 1, 2012
575.365 mln
-84.527 mln
-12.81%
jan 1, 2013
859.48 mln
+284.115 mln
49.38%
jan 1, 2014
1.18 bln
+320.477 mln
37.29%
jan 1, 2015
1.212 bln
+31.907 mln
2.7%
Ranking of countries by current statistics by years
