29
/
en
AIzaSyAYiBZKx7MnpbEhh9jyipgxe19OcubqV5w
April 1, 2024
277292
Uruguay
URY
true
2
1
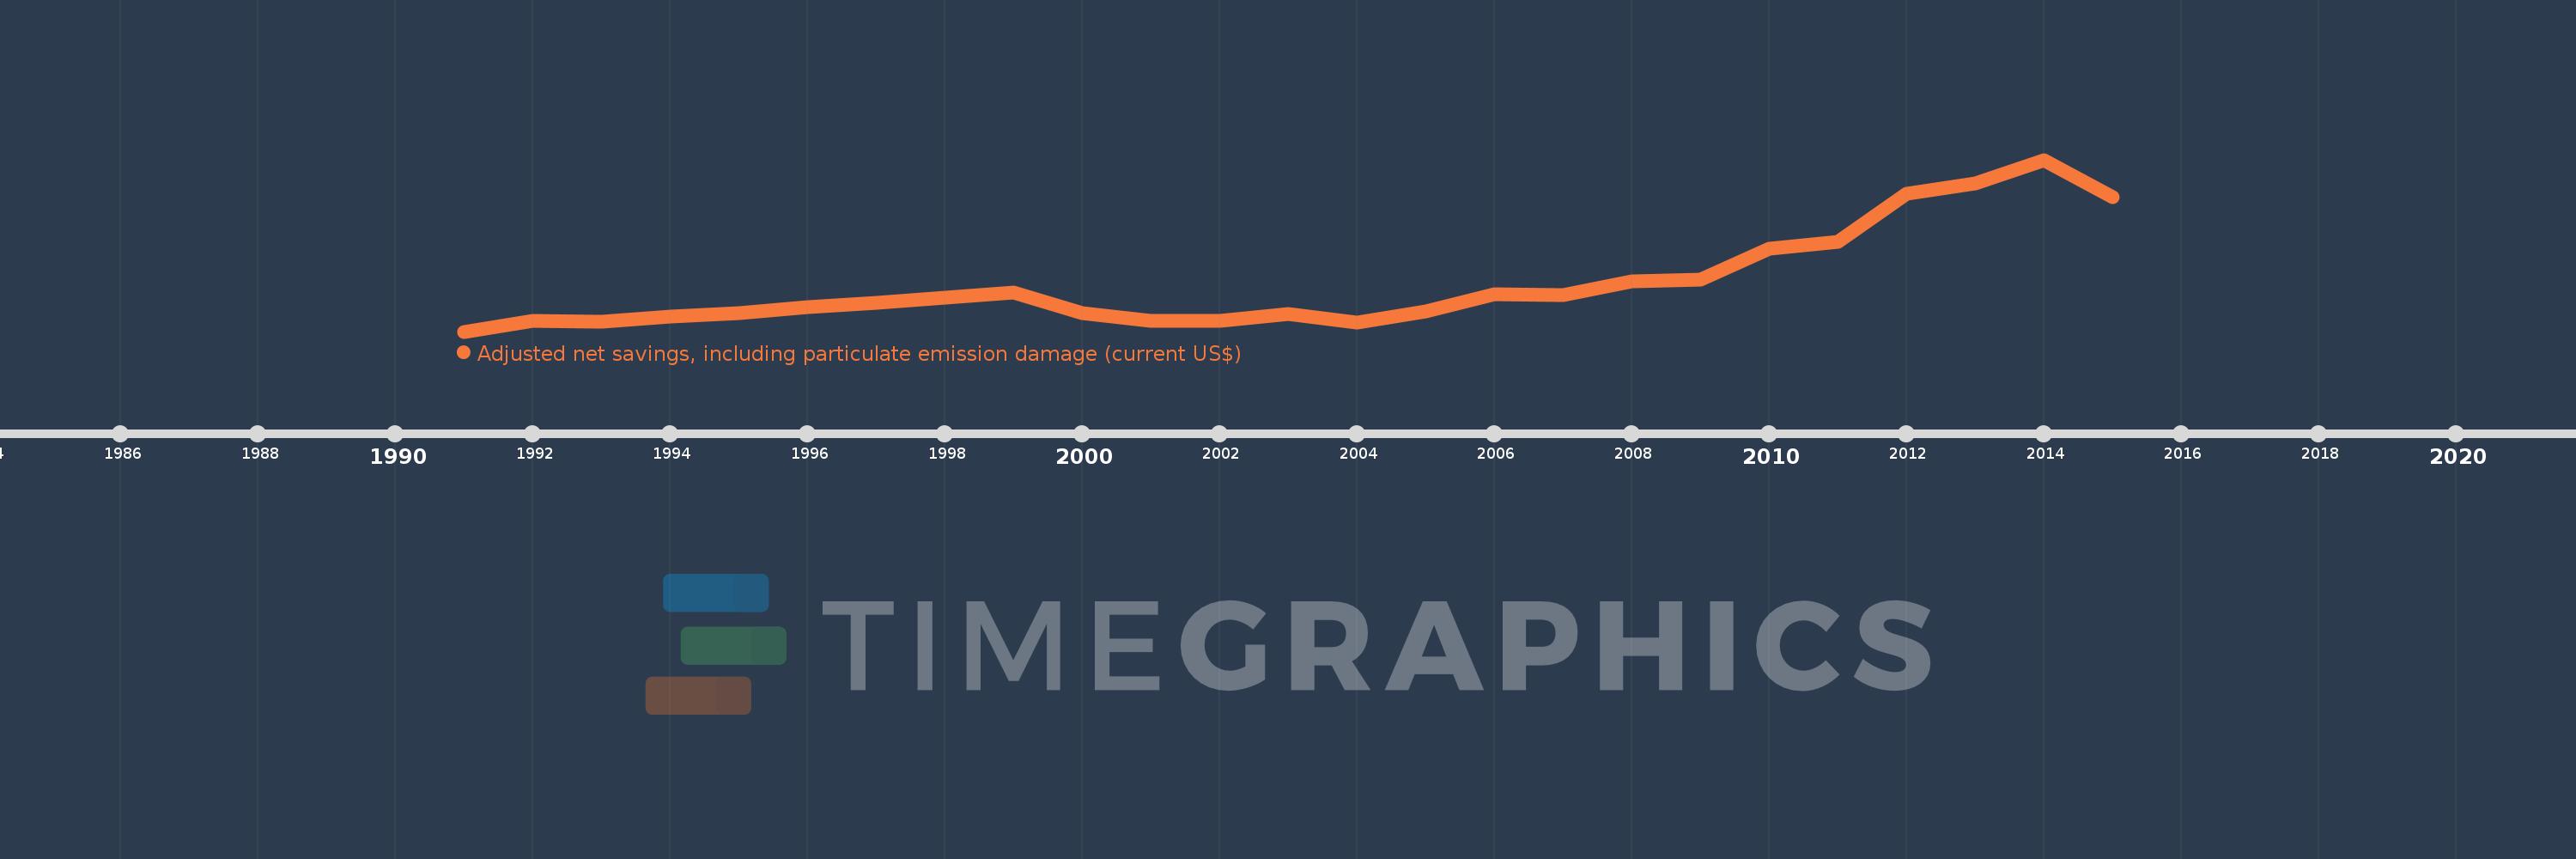
Adjusted net savings, including particulate emission damage (current US$)
2015,2014,2013,2012,2011,2010,2009,2008,2007,2006,2005,2004,2003,2002,2001,2000,1999,1998,1997,1996,1995,1994,1993,1992,1991
This statistics in other country:
AfghanistanAlbaniaAlgeriaAngolaArgentinaArmeniaAustraliaAustriaAzerbaijanBahamas, TheBahrainBangladeshBarbadosBelarusBelgiumBelizeBeninBhutanBoliviaBotswanaBrazilBrunei DarussalamBulgariaBurkina FasoBurundiCabo VerdeCambodiaCameroonCanadaCentral African RepublicChadChileChinaColombiaComorosCongo, Dem. Rep.Congo, Rep.Costa RicaCote d'IvoireCroatiaCyprusCzech RepublicDenmarkDominican RepublicEcuadorEgypt, Arab Rep.El SalvadorEquatorial GuineaEritreaEstoniaEthiopiaFijiFinlandFranceGabonGambia, TheGeorgiaGermanyGhanaGreeceGuatemalaGuineaGuinea-BissauGuyanaHaitiHondurasHungaryIcelandIndiaIndonesiaIran, Islamic Rep.IraqIrelandIsraelItalyJamaicaJapanJordanKazakhstanKenyaKorea, Rep.KuwaitKyrgyz RepublicLao PDRLatviaLebanonLesothoLiberiaLibyaLithuaniaLuxembourgMacedonia, FYRMadagascarMalawiMalaysiaMaldivesMaliMauritaniaMauritiusMexicoMoldovaMongoliaMoroccoMozambiqueNamibiaNepalNetherlandsNew ZealandNicaraguaNigerNigeriaNorwayOmanPakistanPanamaPapua New GuineaParaguayPeruPhilippinesPolandPortugalQatarRomaniaRussian FederationRwandaSaudi ArabiaSenegalSierra LeoneSingaporeSlovak RepublicSloveniaSolomon IslandsSouth AfricaSpainSri LankaSudanSurinameSwazilandSwedenSwitzerlandSyrian Arab RepublicTajikistanTanzaniaThailandTogoTrinidad and TobagoTunisiaTurkeyUgandaUkraineUnited KingdomUnited StatesUruguayVenezuela, RBVietnamYemen, Rep.ZambiaZimbabwe Timeline:
This timeline shows a graph from 1991 to 2015 of Uruguay. No data until 1990. Number of actual observations by date: 25.
Source name:
World Development Indicators
Source organization:
World Bank staff estimates based on sources and methods in World Bank's "The Changing Wealth of Nations: Measuring Sustainable Development in the New Millennium" (2011).
Categories, topics:
Economy & Growth, Environment
Last updated:
apr 23, 2017
Indicators value changes by year
Minimum:
569.155 mln
jan 1, 1991
Maximum:
5.648 bln
jan 1, 2014
At the date of observation
Value
Absolute change
Change from previous value
jan 1, 1991
569.155 mln
+569.155 mln
0.0%
jan 1, 1992
897.903 mln
+328.748 mln
57.76%
jan 1, 1993
850.885 mln
-47.018 mln
-5.24%
jan 1, 1994
1.012 bln
+160.806 mln
18.9%
jan 1, 1995
1.116 bln
+104.231 mln
10.3%
jan 1, 1996
1.297 bln
+180.63 mln
16.19%
jan 1, 1997
1.412 bln
+114.959 mln
8.87%
jan 1, 1998
1.577 bln
+165.007 mln
11.69%
jan 1, 1999
1.724 bln
+147.742 mln
9.37%
jan 1, 2000
1.106 bln
-618.472 mln
-35.87%
jan 1, 2001
875.456 mln
-230.33 mln
-20.83%
jan 1, 2002
898.313 mln
+22.857 mln
2.61%
jan 1, 2003
1.1 bln
+201.558 mln
22.44%
jan 1, 2004
845.385 mln
-254.486 mln
-23.14%
jan 1, 2005
1.174 bln
+328.464 mln
38.85%
jan 1, 2006
1.675 bln
+501.332 mln
42.71%
jan 1, 2007
1.637 bln
-38.397 mln
-2.29%
jan 1, 2008
2.051 bln
+413.935 mln
25.29%
jan 1, 2009
2.103 bln
+52.407 mln
2.56%
jan 1, 2010
3.028 bln
+924.408 mln
43.95%
jan 1, 2011
3.222 bln
+194.08 mln
6.41%
jan 1, 2012
4.638 bln
+1.416 bln
43.96%
jan 1, 2013
4.937 bln
+299.469 mln
6.46%
jan 1, 2014
5.648 bln
+710.566 mln
14.39%
jan 1, 2015
4.534 bln
-1.114 bln
-19.72%
Ranking of countries by current statistics by years


Comments: