29
/
en
AIzaSyAYiBZKx7MnpbEhh9jyipgxe19OcubqV5w
April 1, 2024
213994
Norway
NOR
true
2
1
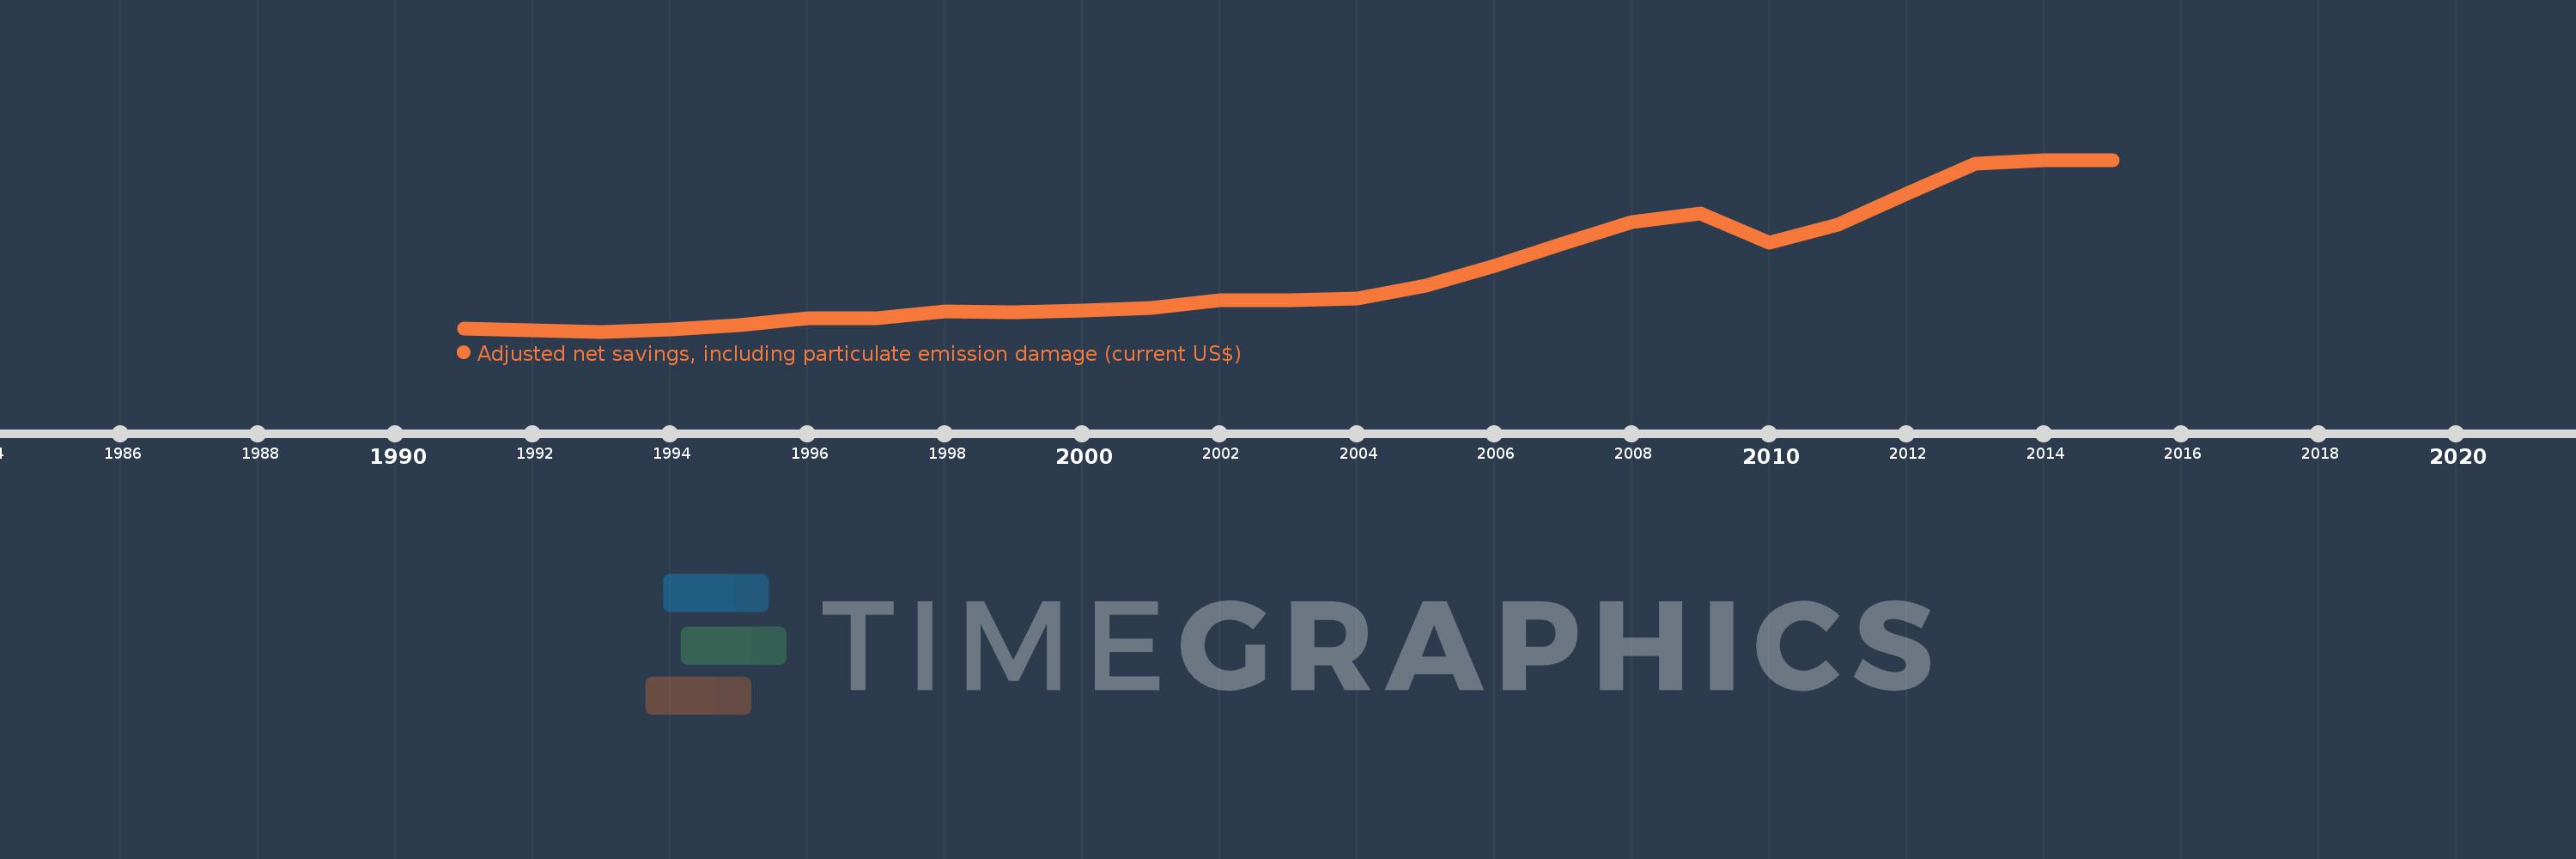
Adjusted net savings, including particulate emission damage (current US$)
2015,2014,2013,2012,2011,2010,2009,2008,2007,2006,2005,2004,2003,2002,2001,2000,1999,1998,1997,1996,1995,1994,1993,1992,1991
This statistics in other country:
AfghanistanAlbaniaAlgeriaAngolaArgentinaArmeniaAustraliaAustriaAzerbaijanBahamas, TheBahrainBangladeshBarbadosBelarusBelgiumBelizeBeninBhutanBoliviaBotswanaBrazilBrunei DarussalamBulgariaBurkina FasoBurundiCabo VerdeCambodiaCameroonCanadaCentral African RepublicChadChileChinaColombiaComorosCongo, Dem. Rep.Congo, Rep.Costa RicaCote d'IvoireCroatiaCyprusCzech RepublicDenmarkDominican RepublicEcuadorEgypt, Arab Rep.El SalvadorEquatorial GuineaEritreaEstoniaEthiopiaFijiFinlandFranceGabonGambia, TheGeorgiaGermanyGhanaGreeceGuatemalaGuineaGuinea-BissauGuyanaHaitiHondurasHungaryIcelandIndiaIndonesiaIran, Islamic Rep.IraqIrelandIsraelItalyJamaicaJapanJordanKazakhstanKenyaKorea, Rep.KuwaitKyrgyz RepublicLao PDRLatviaLebanonLesothoLiberiaLibyaLithuaniaLuxembourgMacedonia, FYRMadagascarMalawiMalaysiaMaldivesMaliMauritaniaMauritiusMexicoMoldovaMongoliaMoroccoMozambiqueNamibiaNepalNetherlandsNew ZealandNicaraguaNigerNigeriaNorwayOmanPakistanPanamaPapua New GuineaParaguayPeruPhilippinesPolandPortugalQatarRomaniaRussian FederationRwandaSaudi ArabiaSenegalSierra LeoneSingaporeSlovak RepublicSloveniaSolomon IslandsSouth AfricaSpainSri LankaSudanSurinameSwazilandSwedenSwitzerlandSyrian Arab RepublicTajikistanTanzaniaThailandTogoTrinidad and TobagoTunisiaTurkeyUgandaUkraineUnited KingdomUnited StatesUruguayVenezuela, RBVietnamYemen, Rep.ZambiaZimbabwe Timeline:
This timeline shows a graph from 1991 to 2015 of Norway. No data until 1990. Number of actual observations by date: 25.
Source name:
World Development Indicators
Source organization:
World Bank staff estimates based on sources and methods in World Bank's "The Changing Wealth of Nations: Measuring Sustainable Development in the New Millennium" (2011).
Categories, topics:
Economy & Growth, Environment
Last updated:
apr 23, 2017
Indicators value changes by year
Minimum:
5.951 bln
jan 1, 1993
Maximum:
107.294 bln
jan 1, 2015
At the date of observation
Value
Absolute change
Change from previous value
jan 1, 1991
7.709 bln
+7.709 bln
0.0%
jan 1, 1992
6.512 bln
-1.197 bln
-15.52%
jan 1, 1993
5.951 bln
-561.41 mln
-8.62%
jan 1, 1994
7.393 bln
+1.442 bln
24.24%
jan 1, 1995
9.54 bln
+2.147 bln
29.04%
jan 1, 1996
14.058 bln
+4.517 bln
47.35%
jan 1, 1997
13.767 bln
-290.982 mln
-2.07%
jan 1, 1998
17.89 bln
+4.123 bln
29.95%
jan 1, 1999
17.426 bln
-464.462 mln
-2.6%
jan 1, 2000
18.287 bln
+861.587 mln
4.94%
jan 1, 2001
19.846 bln
+1.559 bln
8.52%
jan 1, 2002
24.509 bln
+4.663 bln
23.5%
jan 1, 2003
24.299 bln
-209.984 mln
-0.86%
jan 1, 2004
25.259 bln
+959.694 mln
3.95%
jan 1, 2005
32.933 bln
+7.674 bln
30.38%
jan 1, 2006
44.925 bln
+11.992 bln
36.41%
jan 1, 2007
57.871 bln
+12.945 bln
28.82%
jan 1, 2008
70.658 bln
+12.787 bln
22.1%
jan 1, 2009
75.379 bln
+4.721 bln
6.68%
jan 1, 2010
58.475 bln
-16.904 bln
-22.43%
jan 1, 2011
68.905 bln
+10.43 bln
17.84%
jan 1, 2012
87.472 bln
+18.568 bln
26.95%
jan 1, 2013
104.807 bln
+17.335 bln
19.82%
jan 1, 2014
107.178 bln
+2.371 bln
2.26%
jan 1, 2015
107.294 bln
+115.568 mln
0.11%
Ranking of countries by current statistics by years


Comments: