29
/
en
AIzaSyAYiBZKx7MnpbEhh9jyipgxe19OcubqV5w
April 1, 2024
121698
Dominican Republic
DOM
true
2
1
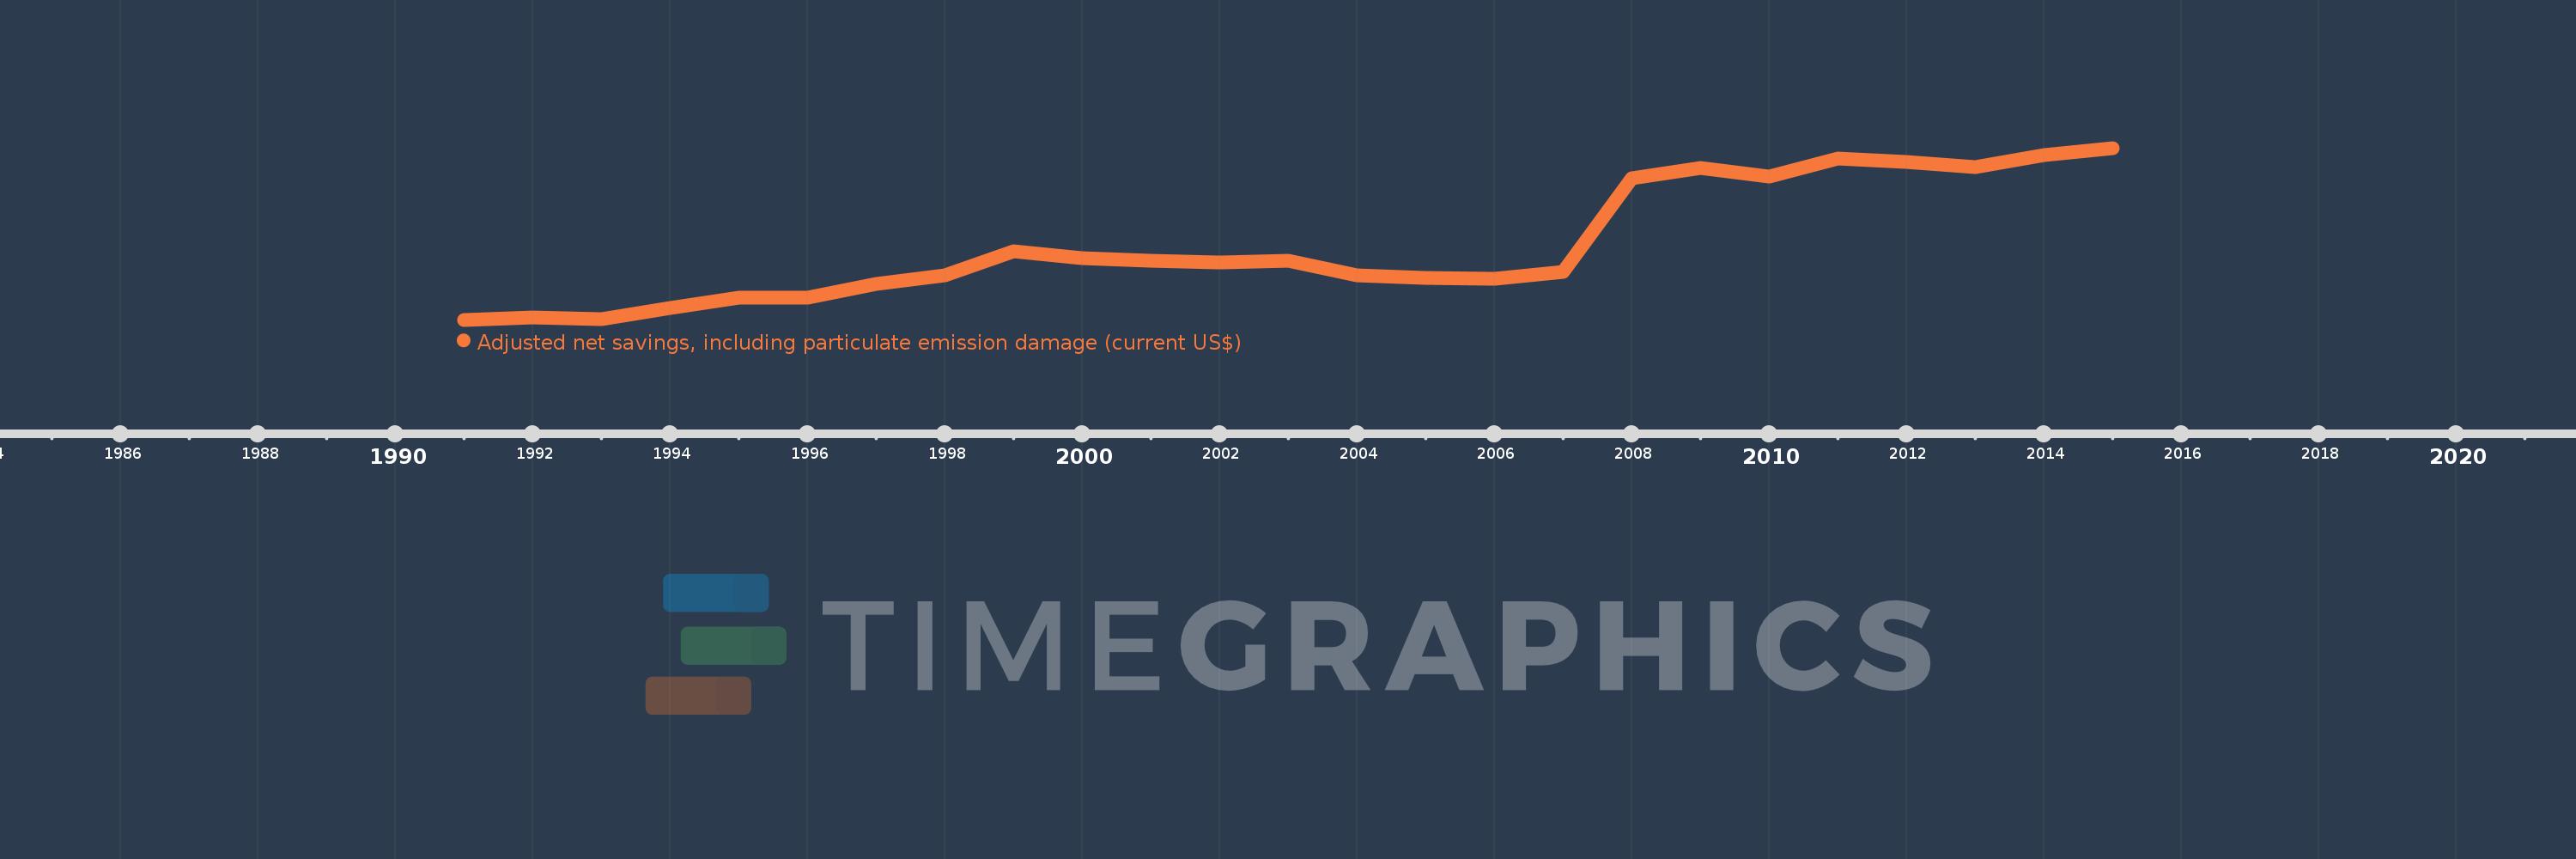
Adjusted net savings, including particulate emission damage (current US$)
2015,2014,2013,2012,2011,2010,2009,2008,2007,2006,2005,2004,2003,2002,2001,2000,1999,1998,1997,1996,1995,1994,1993,1992,1991
This statistics in other country:
AfghanistanAlbaniaAlgeriaAngolaArgentinaArmeniaAustraliaAustriaAzerbaijanBahamas, TheBahrainBangladeshBarbadosBelarusBelgiumBelizeBeninBhutanBoliviaBotswanaBrazilBrunei DarussalamBulgariaBurkina FasoBurundiCabo VerdeCambodiaCameroonCanadaCentral African RepublicChadChileChinaColombiaComorosCongo, Dem. Rep.Congo, Rep.Costa RicaCote d'IvoireCroatiaCyprusCzech RepublicDenmarkDominican RepublicEcuadorEgypt, Arab Rep.El SalvadorEquatorial GuineaEritreaEstoniaEthiopiaFijiFinlandFranceGabonGambia, TheGeorgiaGermanyGhanaGreeceGuatemalaGuineaGuinea-BissauGuyanaHaitiHondurasHungaryIcelandIndiaIndonesiaIran, Islamic Rep.IraqIrelandIsraelItalyJamaicaJapanJordanKazakhstanKenyaKorea, Rep.KuwaitKyrgyz RepublicLao PDRLatviaLebanonLesothoLiberiaLibyaLithuaniaLuxembourgMacedonia, FYRMadagascarMalawiMalaysiaMaldivesMaliMauritaniaMauritiusMexicoMoldovaMongoliaMoroccoMozambiqueNamibiaNepalNetherlandsNew ZealandNicaraguaNigerNigeriaNorwayOmanPakistanPanamaPapua New GuineaParaguayPeruPhilippinesPolandPortugalQatarRomaniaRussian FederationRwandaSaudi ArabiaSenegalSierra LeoneSingaporeSlovak RepublicSloveniaSolomon IslandsSouth AfricaSpainSri LankaSudanSurinameSwazilandSwedenSwitzerlandSyrian Arab RepublicTajikistanTanzaniaThailandTogoTrinidad and TobagoTunisiaTurkeyUgandaUkraineUnited KingdomUnited StatesUruguayVenezuela, RBVietnamYemen, Rep.ZambiaZimbabwe Timeline:
This timeline shows a graph from 1991 to 2015 of Dominican Republic. No data until 1990. Number of actual observations by date: 25.
Source name:
World Development Indicators
Source organization:
World Bank staff estimates based on sources and methods in World Bank's "The Changing Wealth of Nations: Measuring Sustainable Development in the New Millennium" (2011).
Categories, topics:
Economy & Growth, Environment
Last updated:
apr 23, 2017
Indicators value changes by year
Minimum:
725.619 mln
jan 1, 1991
Maximum:
8.876 bln
jan 1, 2015
At the date of observation
Value
Absolute change
Change from previous value
jan 1, 1991
725.619 mln
+725.619 mln
0.0%
jan 1, 1992
829.353 mln
+103.734 mln
14.3%
jan 1, 1993
751.87 mln
-77.483 mln
-9.34%
jan 1, 1994
1.283 bln
+531.172 mln
70.65%
jan 1, 1995
1.768 bln
+484.461 mln
37.76%
jan 1, 1996
1.755 bln
-12.197 mln
-0.69%
jan 1, 1997
2.433 bln
+677.678 mln
38.61%
jan 1, 1998
2.838 bln
+404.835 mln
16.64%
jan 1, 1999
3.98 bln
+1.143 bln
40.26%
jan 1, 2000
3.645 bln
-335.203 mln
-8.42%
jan 1, 2001
3.514 bln
-130.923 mln
-3.59%
jan 1, 2002
3.429 bln
-85.15 mln
-2.42%
jan 1, 2003
3.521 bln
+92.331 mln
2.69%
jan 1, 2004
2.813 bln
-708.491 mln
-20.12%
jan 1, 2005
2.726 bln
-86.597 mln
-3.08%
jan 1, 2006
2.688 bln
-38.347 mln
-1.41%
jan 1, 2007
3.012 bln
+324.453 mln
12.07%
jan 1, 2008
7.429 bln
+4.416 bln
146.6%
jan 1, 2009
7.92 bln
+491.595 mln
6.62%
jan 1, 2010
7.507 bln
-413.299 mln
-5.22%
jan 1, 2011
8.375 bln
+867.936 mln
11.56%
jan 1, 2012
8.223 bln
-151.967 mln
-1.81%
jan 1, 2013
7.957 bln
-266.395 mln
-3.24%
jan 1, 2014
8.53 bln
+573.263 mln
7.2%
jan 1, 2015
8.876 bln
+346.064 mln
4.06%
Ranking of countries by current statistics by years


Comments: