29
/
en
AIzaSyAYiBZKx7MnpbEhh9jyipgxe19OcubqV5w
April 1, 2024
256997
Switzerland
CHE
true
2
1
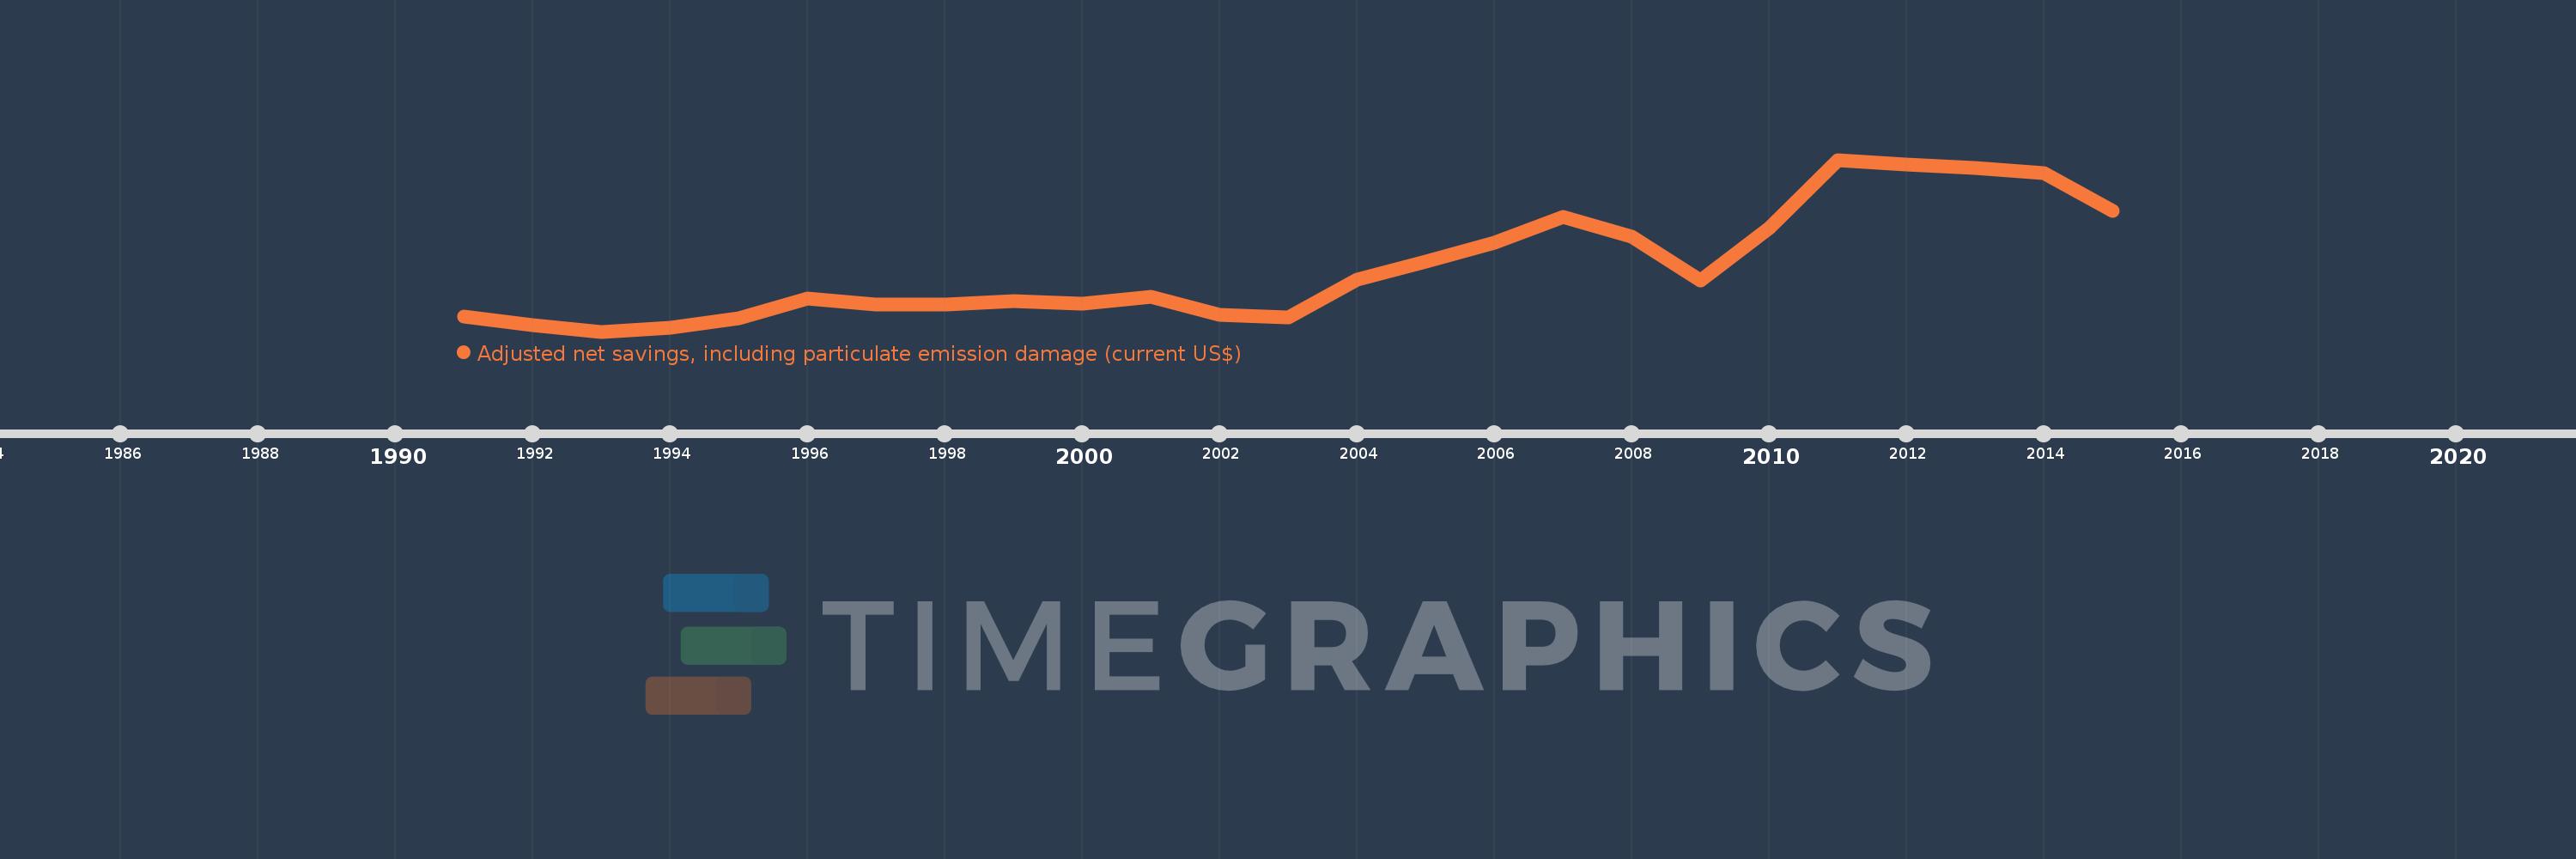
Adjusted net savings, including particulate emission damage (current US$)
2015,2014,2013,2012,2011,2010,2009,2008,2007,2006,2005,2004,2003,2002,2001,2000,1999,1998,1997,1996,1995,1994,1993,1992,1991
This statistics in other country:
AfghanistanAlbaniaAlgeriaAngolaArgentinaArmeniaAustraliaAustriaAzerbaijanBahamas, TheBahrainBangladeshBarbadosBelarusBelgiumBelizeBeninBhutanBoliviaBotswanaBrazilBrunei DarussalamBulgariaBurkina FasoBurundiCabo VerdeCambodiaCameroonCanadaCentral African RepublicChadChileChinaColombiaComorosCongo, Dem. Rep.Congo, Rep.Costa RicaCote d'IvoireCroatiaCyprusCzech RepublicDenmarkDominican RepublicEcuadorEgypt, Arab Rep.El SalvadorEquatorial GuineaEritreaEstoniaEthiopiaFijiFinlandFranceGabonGambia, TheGeorgiaGermanyGhanaGreeceGuatemalaGuineaGuinea-BissauGuyanaHaitiHondurasHungaryIcelandIndiaIndonesiaIran, Islamic Rep.IraqIrelandIsraelItalyJamaicaJapanJordanKazakhstanKenyaKorea, Rep.KuwaitKyrgyz RepublicLao PDRLatviaLebanonLesothoLiberiaLibyaLithuaniaLuxembourgMacedonia, FYRMadagascarMalawiMalaysiaMaldivesMaliMauritaniaMauritiusMexicoMoldovaMongoliaMoroccoMozambiqueNamibiaNepalNetherlandsNew ZealandNicaraguaNigerNigeriaNorwayOmanPakistanPanamaPapua New GuineaParaguayPeruPhilippinesPolandPortugalQatarRomaniaRussian FederationRwandaSaudi ArabiaSenegalSierra LeoneSingaporeSlovak RepublicSloveniaSolomon IslandsSouth AfricaSpainSri LankaSudanSurinameSwazilandSwedenSwitzerlandSyrian Arab RepublicTajikistanTanzaniaThailandTogoTrinidad and TobagoTunisiaTurkeyUgandaUkraineUnited KingdomUnited StatesUruguayVenezuela, RBVietnamYemen, Rep.ZambiaZimbabwe Timeline:
This timeline shows a graph from 1991 to 2015 of Switzerland. No data until 1990. Number of actual observations by date: 25.
Source name:
World Development Indicators
Source organization:
World Bank staff estimates based on sources and methods in World Bank's "The Changing Wealth of Nations: Measuring Sustainable Development in the New Millennium" (2011).
Categories, topics:
Economy & Growth, Environment
Last updated:
apr 23, 2017
Indicators value changes by year
Minimum:
36.053 bln
jan 1, 1993
Maximum:
133.178 bln
jan 1, 2011
At the date of observation
Value
Absolute change
Change from previous value
jan 1, 1991
44.336 bln
+44.336 bln
0.0%
jan 1, 1992
39.645 bln
-4.692 bln
-10.58%
jan 1, 1993
36.053 bln
-3.592 bln
-9.06%
jan 1, 1994
38.227 bln
+2.174 bln
6.03%
jan 1, 1995
43.79 bln
+5.563 bln
14.55%
jan 1, 1996
54.697 bln
+10.907 bln
24.91%
jan 1, 1997
51.364 bln
-3.332 bln
-6.09%
jan 1, 1998
51.289 bln
-75.004 mln
-0.15%
jan 1, 1999
53.293 bln
+2.004 bln
3.91%
jan 1, 2000
51.735 bln
-1.558 bln
-2.92%
jan 1, 2001
55.928 bln
+4.193 bln
8.1%
jan 1, 2002
45.339 bln
-10.589 bln
-18.93%
jan 1, 2003
44.032 bln
-1.307 bln
-2.88%
jan 1, 2004
65.621 bln
+21.588 bln
49.03%
jan 1, 2005
75.449 bln
+9.829 bln
14.98%
jan 1, 2006
86.488 bln
+11.039 bln
14.63%
jan 1, 2007
100.72 bln
+14.232 bln
16.45%
jan 1, 2008
89.786 bln
-10.934 bln
-10.86%
jan 1, 2009
64.721 bln
-25.065 bln
-27.92%
jan 1, 2010
94.344 bln
+29.623 bln
45.77%
jan 1, 2011
133.178 bln
+38.834 bln
41.16%
jan 1, 2012
130.617 bln
-2.561 bln
-1.92%
jan 1, 2013
128.485 bln
-2.132 bln
-1.63%
jan 1, 2014
125.781 bln
-2.704 bln
-2.1%
jan 1, 2015
104.386 bln
-21.394 bln
-17.01%
Ranking of countries by current statistics by years


Comments: