29
/
en
AIzaSyAYiBZKx7MnpbEhh9jyipgxe19OcubqV5w
April 1, 2024
90715
Brazil
BRA
true
2
1
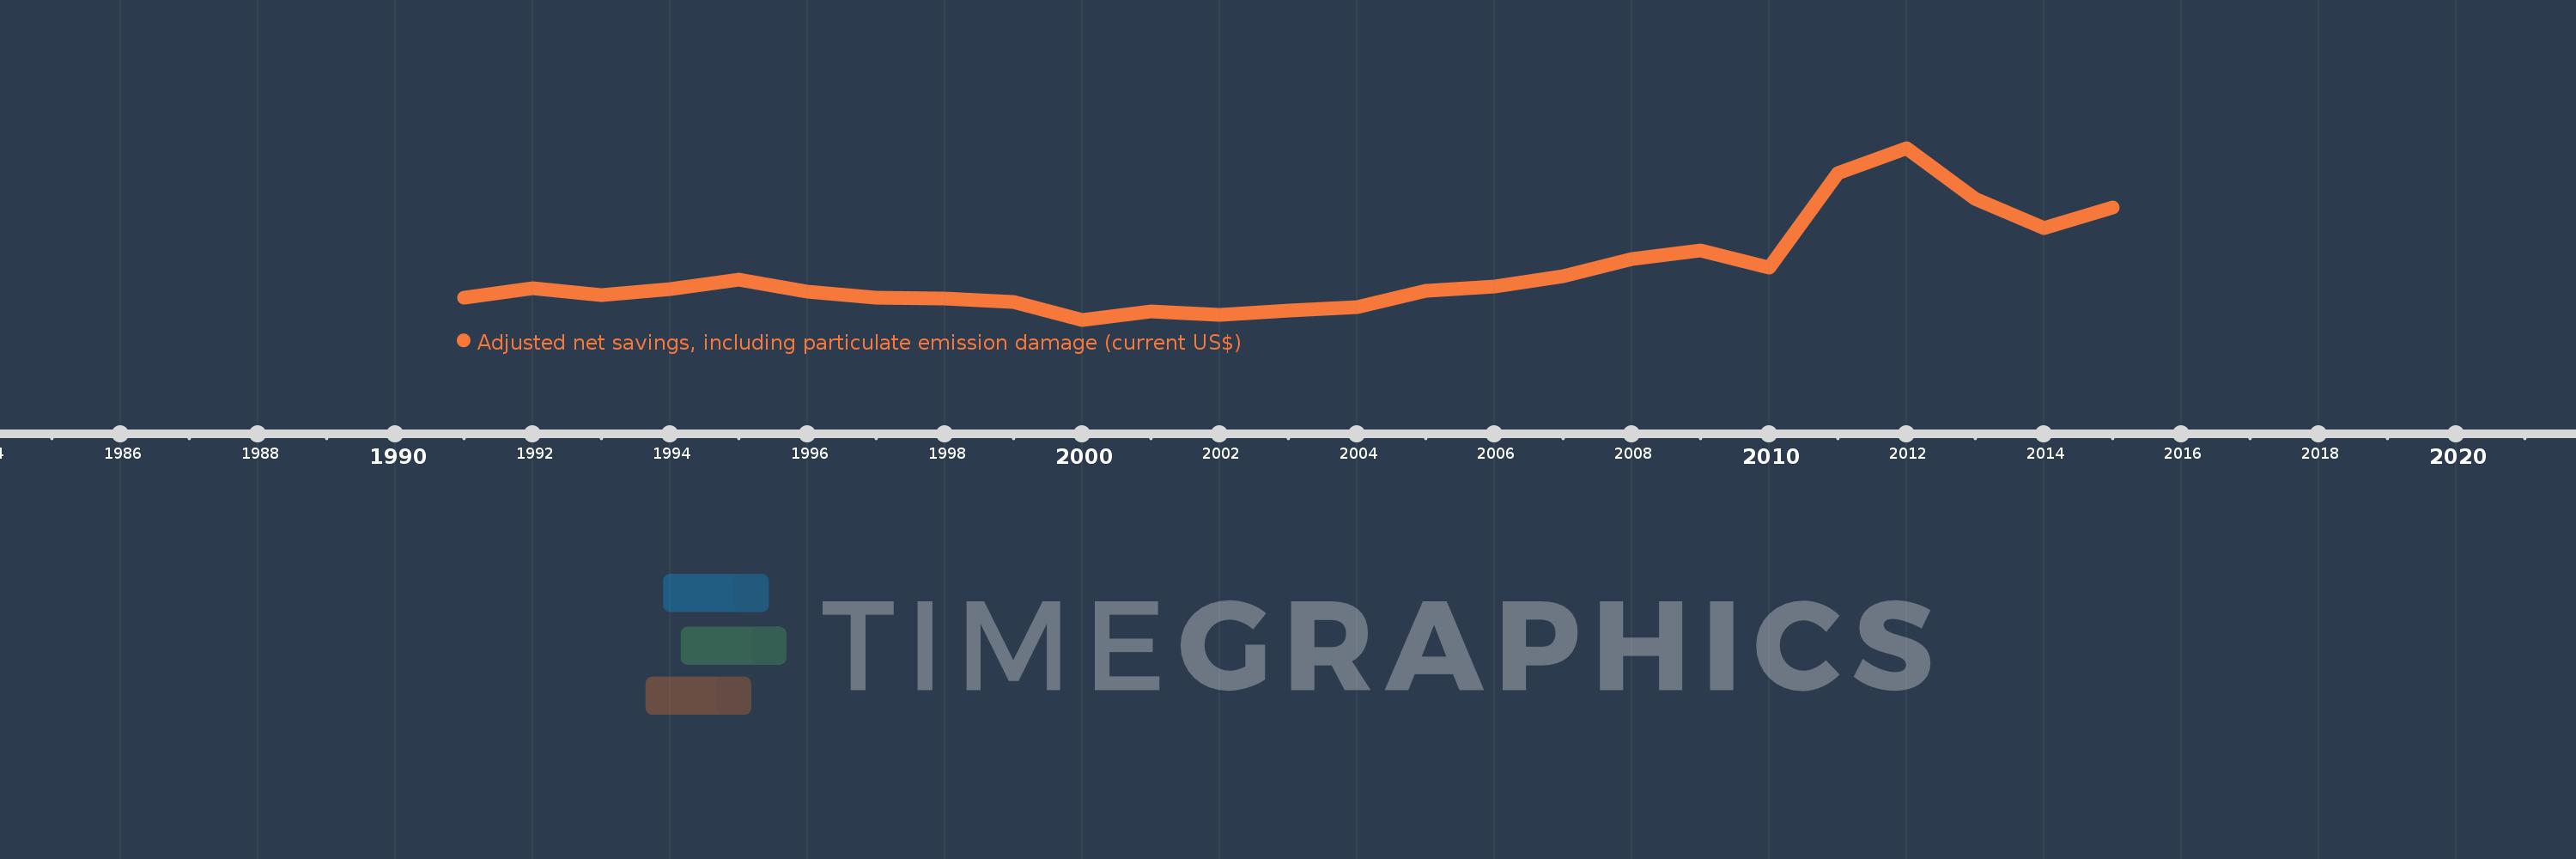
Adjusted net savings, including particulate emission damage (current US$)
2015,2014,2013,2012,2011,2010,2009,2008,2007,2006,2005,2004,2003,2002,2001,2000,1999,1998,1997,1996,1995,1994,1993,1992,1991
This statistics in other country:
AfghanistanAlbaniaAlgeriaAngolaArgentinaArmeniaAustraliaAustriaAzerbaijanBahamas, TheBahrainBangladeshBarbadosBelarusBelgiumBelizeBeninBhutanBoliviaBotswanaBrazilBrunei DarussalamBulgariaBurkina FasoBurundiCabo VerdeCambodiaCameroonCanadaCentral African RepublicChadChileChinaColombiaComorosCongo, Dem. Rep.Congo, Rep.Costa RicaCote d'IvoireCroatiaCyprusCzech RepublicDenmarkDominican RepublicEcuadorEgypt, Arab Rep.El SalvadorEquatorial GuineaEritreaEstoniaEthiopiaFijiFinlandFranceGabonGambia, TheGeorgiaGermanyGhanaGreeceGuatemalaGuineaGuinea-BissauGuyanaHaitiHondurasHungaryIcelandIndiaIndonesiaIran, Islamic Rep.IraqIrelandIsraelItalyJamaicaJapanJordanKazakhstanKenyaKorea, Rep.KuwaitKyrgyz RepublicLao PDRLatviaLebanonLesothoLiberiaLibyaLithuaniaLuxembourgMacedonia, FYRMadagascarMalawiMalaysiaMaldivesMaliMauritaniaMauritiusMexicoMoldovaMongoliaMoroccoMozambiqueNamibiaNepalNetherlandsNew ZealandNicaraguaNigerNigeriaNorwayOmanPakistanPanamaPapua New GuineaParaguayPeruPhilippinesPolandPortugalQatarRomaniaRussian FederationRwandaSaudi ArabiaSenegalSierra LeoneSingaporeSlovak RepublicSloveniaSolomon IslandsSouth AfricaSpainSri LankaSudanSurinameSwazilandSwedenSwitzerlandSyrian Arab RepublicTajikistanTanzaniaThailandTogoTrinidad and TobagoTunisiaTurkeyUgandaUkraineUnited KingdomUnited StatesUruguayVenezuela, RBVietnamYemen, Rep.ZambiaZimbabwe Timeline:
This timeline shows a graph from 1991 to 2015 of Brazil. No data until 1990. Number of actual observations by date: 25.
Source name:
World Development Indicators
Source organization:
World Bank staff estimates based on sources and methods in World Bank's "The Changing Wealth of Nations: Measuring Sustainable Development in the New Millennium" (2011).
Categories, topics:
Economy & Growth, Environment
Last updated:
apr 23, 2017
Indicators value changes by year
Minimum:
-984.368 mln
jan 1, 2000
Maximum:
265.846 bln
jan 1, 2012
At the date of observation
Value
Absolute change
Change from previous value
jan 1, 1991
33.461 bln
+33.461 bln
0.0%
jan 1, 1992
48.484 bln
+15.023 bln
44.9%
jan 1, 1993
37.809 bln
-10.675 bln
-22.02%
jan 1, 1994
46.291 bln
+8.483 bln
22.44%
jan 1, 1995
60.737 bln
+14.445 bln
31.2%
jan 1, 1996
42.629 bln
-18.107 bln
-29.81%
jan 1, 1997
33.293 bln
-9.337 bln
-21.9%
jan 1, 1998
31.607 bln
-1.685 bln
-5.06%
jan 1, 1999
26.811 bln
-4.796 bln
-15.17%
jan 1, 2000
-984.368 mln
-27.795 bln
-103.67%
jan 1, 2001
12.261 bln
+13.245 bln
-1.35K%
jan 1, 2002
7.153 bln
-5.108 bln
-41.66%
jan 1, 2003
13.831 bln
+6.678 bln
93.37%
jan 1, 2004
18.129 bln
+4.298 bln
31.08%
jan 1, 2005
44.026 bln
+25.896 bln
142.84%
jan 1, 2006
51.132 bln
+7.106 bln
16.14%
jan 1, 2007
67.015 bln
+15.883 bln
31.06%
jan 1, 2008
93.256 bln
+26.241 bln
39.16%
jan 1, 2009
106.686 bln
+13.43 bln
14.4%
jan 1, 2010
79.466 bln
-27.22 bln
-25.51%
jan 1, 2011
227.345 bln
+147.879 bln
186.09%
jan 1, 2012
265.846 bln
+38.501 bln
16.94%
jan 1, 2013
186.08 bln
-79.766 bln
-30.0%
jan 1, 2014
141.39 bln
-44.69 bln
-24.02%
jan 1, 2015
173.86 bln
+32.471 bln
22.97%
Ranking of countries by current statistics by years


Comments: