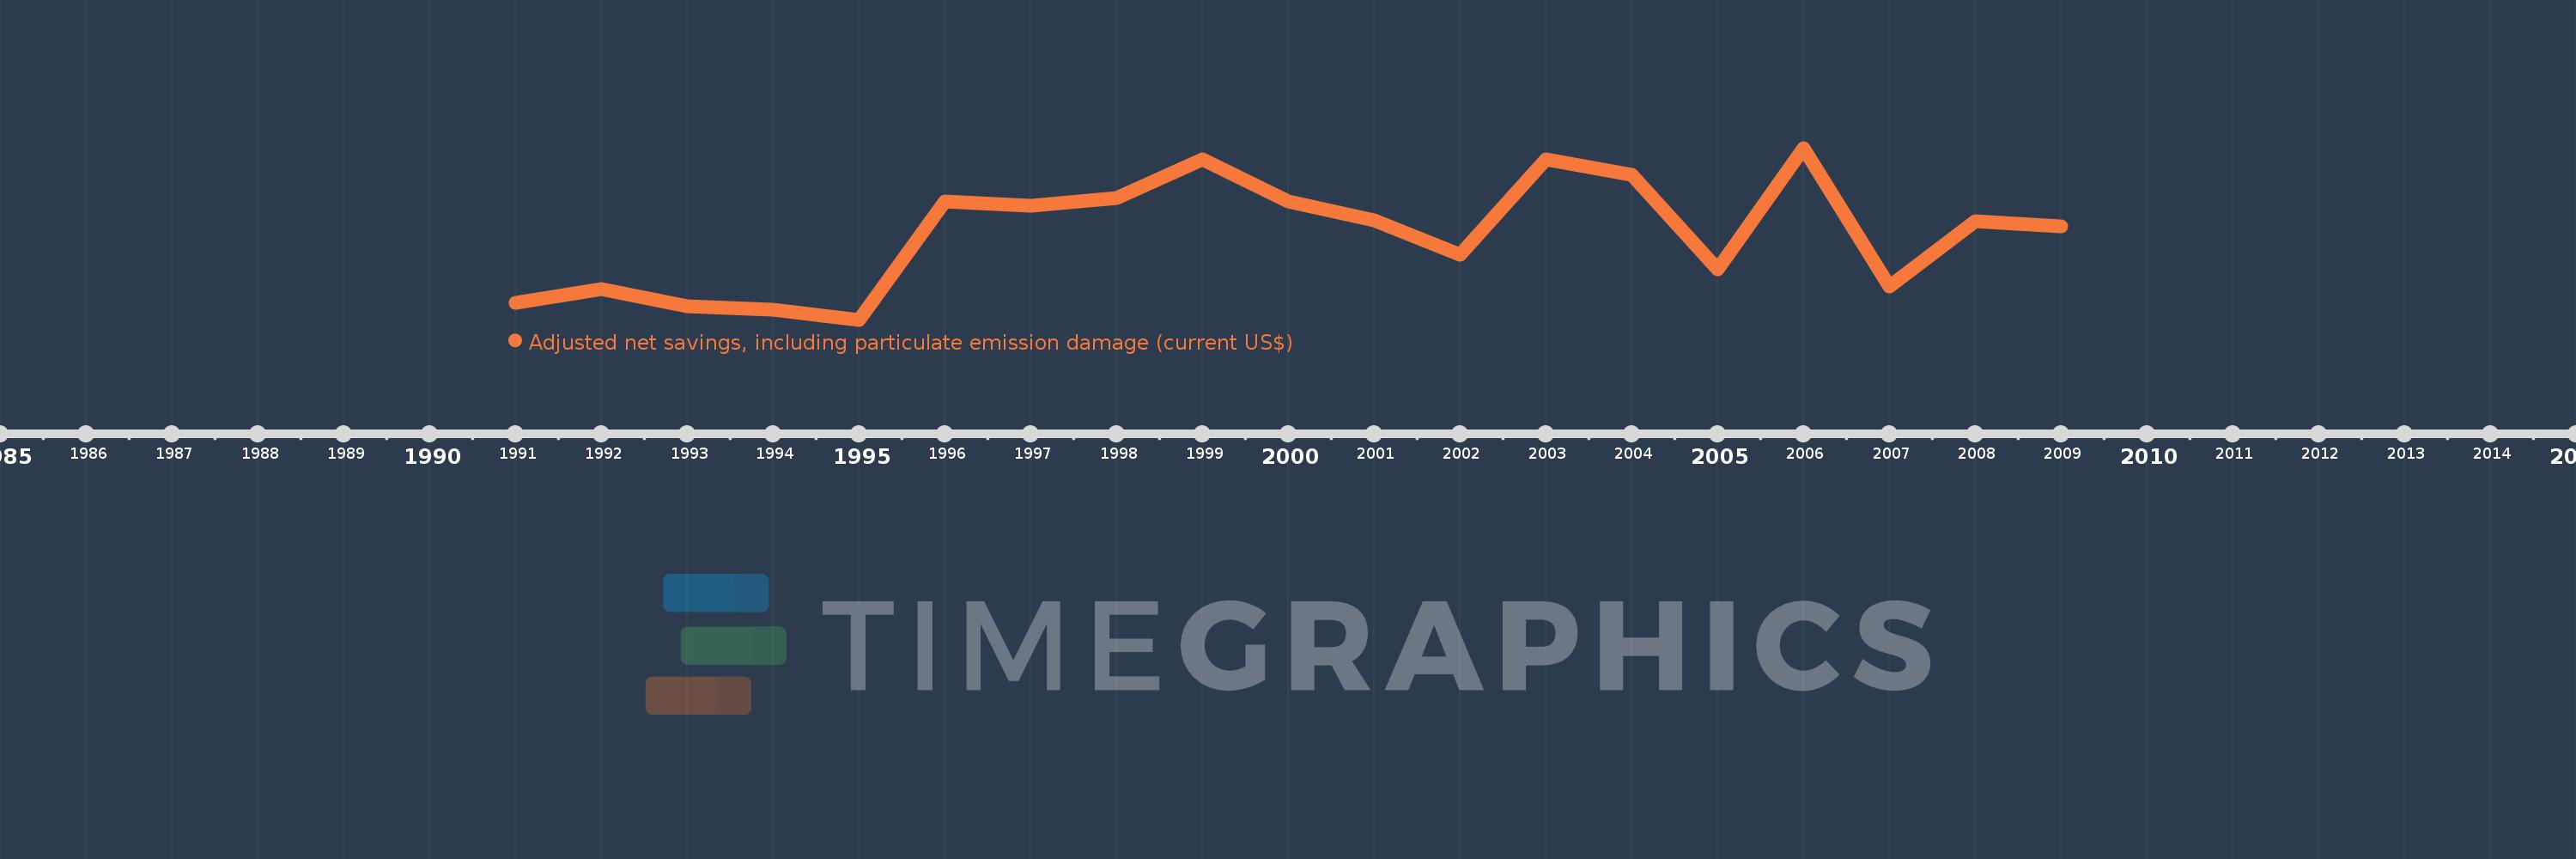
This timeline shows a graph from 1991 to 2009 of Fiji. No data until 1990. Number of actual observations by date: 19.
Source name:
World Development Indicators
Source organization:
World Bank staff estimates based on sources and methods in World Bank's "The Changing Wealth of Nations: Measuring Sustainable Development in the New Millennium" (2011).
Categories, topics:
Economy & Growth, Environment
Last updated:
apr 23, 2017
Indicators value changes by year
Meaning:
141.875 mln
Minimum:
-81.579 mln
jan 1, 1995
Maximum:
368.577 mln
jan 1, 2006
At the date of observation
Value
Absolute change
Change from the previous value
jan 1, 1991
-38.051 mln
-38.051 mln
0.0%
jan 1, 1992
-504.092K
+37.546 mln
-98.68%
jan 1, 1993
-45.603 mln
-45.099 mln
8.95K%
jan 1, 1994
-55.541 mln
-9.937 mln
21.79%
jan 1, 1995
-81.579 mln
-26.039 mln
46.88%
jan 1, 1996
228.212 mln
+309.791 mln
-379.74%
jan 1, 1997
217.29 mln
-10.922 mln
-4.79%
jan 1, 1998
236.326 mln
+19.036 mln
8.76%
jan 1, 1999
338.491 mln
+102.166 mln
43.23%
jan 1, 2000
227.621 mln
-110.87 mln
-32.75%
jan 1, 2001
177.993 mln
-49.628 mln
-21.8%
jan 1, 2002
89.897 mln
-88.095 mln
-49.49%
jan 1, 2003
337.909 mln
+248.012 mln
275.88%
jan 1, 2004
297.849 mln
-40.06 mln
-11.86%
jan 1, 2005
51.605 mln
-246.244 mln
-82.67%
jan 1, 2006
368.577 mln
+316.972 mln
614.22%
jan 1, 2007
5.17 mln
-363.407 mln
-98.6%
jan 1, 2008
177.013 mln
+171.843 mln
3.32K%
jan 1, 2009
162.958 mln
-14.055 mln
-7.94%
Ranking of countries by current statistics by years
