29
/
en
AIzaSyAYiBZKx7MnpbEhh9jyipgxe19OcubqV5w
April 1, 2024
154178
India
IND
true
2
1
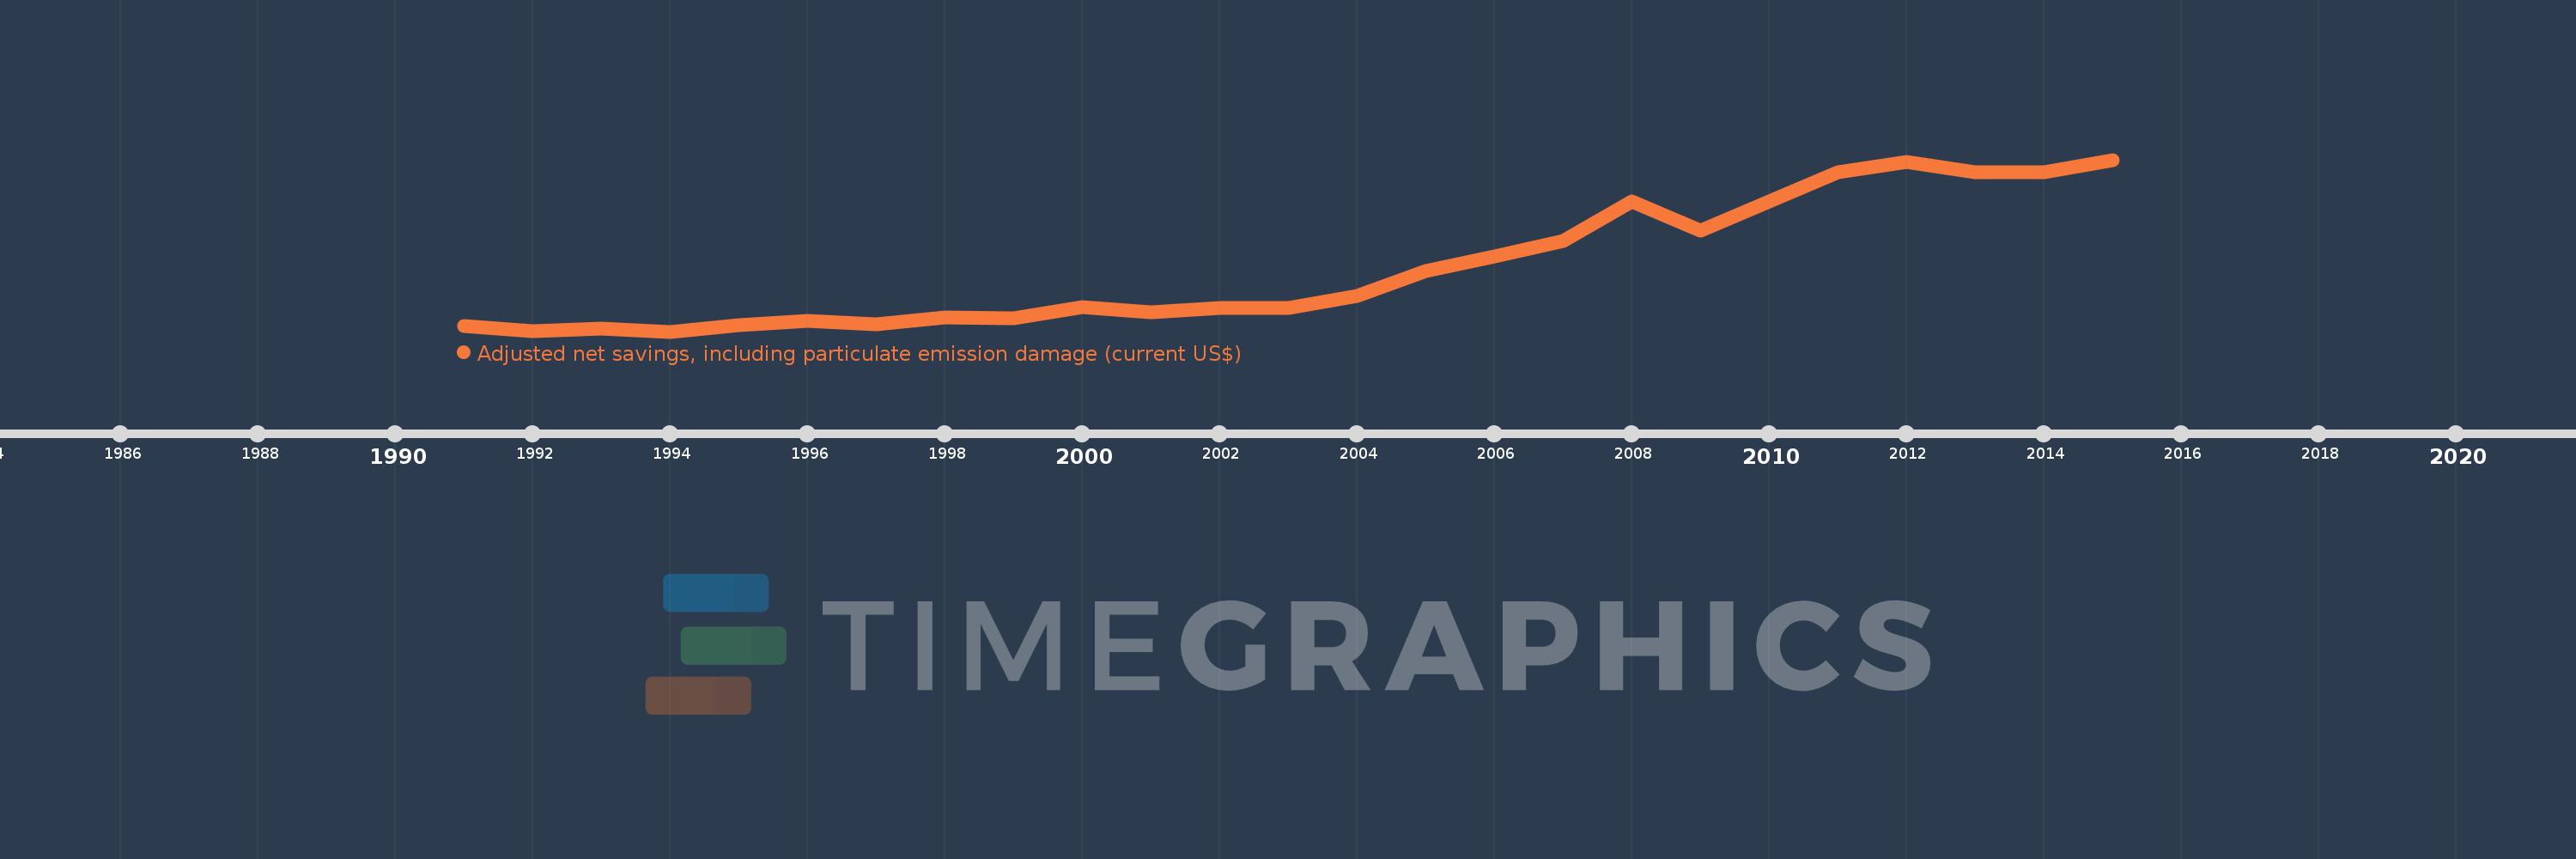
Adjusted net savings, including particulate emission damage (current US$)
2015,2014,2013,2012,2011,2010,2009,2008,2007,2006,2005,2004,2003,2002,2001,2000,1999,1998,1997,1996,1995,1994,1993,1992,1991
This statistics in other country:
AfghanistanAlbaniaAlgeriaAngolaArgentinaArmeniaAustraliaAustriaAzerbaijanBahamas, TheBahrainBangladeshBarbadosBelarusBelgiumBelizeBeninBhutanBoliviaBotswanaBrazilBrunei DarussalamBulgariaBurkina FasoBurundiCabo VerdeCambodiaCameroonCanadaCentral African RepublicChadChileChinaColombiaComorosCongo, Dem. Rep.Congo, Rep.Costa RicaCote d'IvoireCroatiaCyprusCzech RepublicDenmarkDominican RepublicEcuadorEgypt, Arab Rep.El SalvadorEquatorial GuineaEritreaEstoniaEthiopiaFijiFinlandFranceGabonGambia, TheGeorgiaGermanyGhanaGreeceGuatemalaGuineaGuinea-BissauGuyanaHaitiHondurasHungaryIcelandIndiaIndonesiaIran, Islamic Rep.IraqIrelandIsraelItalyJamaicaJapanJordanKazakhstanKenyaKorea, Rep.KuwaitKyrgyz RepublicLao PDRLatviaLebanonLesothoLiberiaLibyaLithuaniaLuxembourgMacedonia, FYRMadagascarMalawiMalaysiaMaldivesMaliMauritaniaMauritiusMexicoMoldovaMongoliaMoroccoMozambiqueNamibiaNepalNetherlandsNew ZealandNicaraguaNigerNigeriaNorwayOmanPakistanPanamaPapua New GuineaParaguayPeruPhilippinesPolandPortugalQatarRomaniaRussian FederationRwandaSaudi ArabiaSenegalSierra LeoneSingaporeSlovak RepublicSloveniaSolomon IslandsSouth AfricaSpainSri LankaSudanSurinameSwazilandSwedenSwitzerlandSyrian Arab RepublicTajikistanTanzaniaThailandTogoTrinidad and TobagoTunisiaTurkeyUgandaUkraineUnited KingdomUnited StatesUruguayVenezuela, RBVietnamYemen, Rep.ZambiaZimbabwe Timeline:
This timeline shows a graph from 1991 to 2015 of India. No data until 1990. Number of actual observations by date: 25.
Source name:
World Development Indicators
Source organization:
World Bank staff estimates based on sources and methods in World Bank's "The Changing Wealth of Nations: Measuring Sustainable Development in the New Millennium" (2011).
Categories, topics:
Economy & Growth, Environment
Last updated:
apr 23, 2017
Indicators value changes by year
Minimum:
21.858 bln
jan 1, 1994
Maximum:
383.956 bln
jan 1, 2015
At the date of observation
Value
Absolute change
Change from previous value
jan 1, 1991
33.087 bln
+33.087 bln
0.0%
jan 1, 1992
22.49 bln
-10.597 bln
-32.03%
jan 1, 1993
27.796 bln
+5.305 bln
23.59%
jan 1, 1994
21.858 bln
-5.938 bln
-21.36%
jan 1, 1995
36.043 bln
+14.185 bln
64.89%
jan 1, 1996
45.347 bln
+9.305 bln
25.82%
jan 1, 1997
36.585 bln
-8.762 bln
-19.32%
jan 1, 1998
52.474 bln
+15.889 bln
43.43%
jan 1, 1999
50.29 bln
-2.184 bln
-4.16%
jan 1, 2000
74.177 bln
+23.887 bln
47.5%
jan 1, 2001
63.111 bln
-11.065 bln
-14.92%
jan 1, 2002
72.057 bln
+8.946 bln
14.18%
jan 1, 2003
72.396 bln
+338.458 mln
0.47%
jan 1, 2004
96.77 bln
+24.375 bln
33.67%
jan 1, 2005
149.377 bln
+52.607 bln
54.36%
jan 1, 2006
180.02 bln
+30.642 bln
20.51%
jan 1, 2007
212.899 bln
+32.88 bln
18.26%
jan 1, 2008
296.48 bln
+83.581 bln
39.26%
jan 1, 2009
235.237 bln
-61.242 bln
-20.66%
jan 1, 2010
296.416 bln
+61.178 bln
26.01%
jan 1, 2011
357.979 bln
+61.563 bln
20.77%
jan 1, 2012
378.951 bln
+20.972 bln
5.86%
jan 1, 2013
358.588 bln
-20.363 bln
-5.37%
jan 1, 2014
357.277 bln
-1.312 bln
-0.37%
jan 1, 2015
383.956 bln
+26.679 bln
7.47%
Ranking of countries by current statistics by years


Comments: