29
/
en
AIzaSyAYiBZKx7MnpbEhh9jyipgxe19OcubqV5w
April 1, 2024
79153
Barbados
BRB
true
2
1
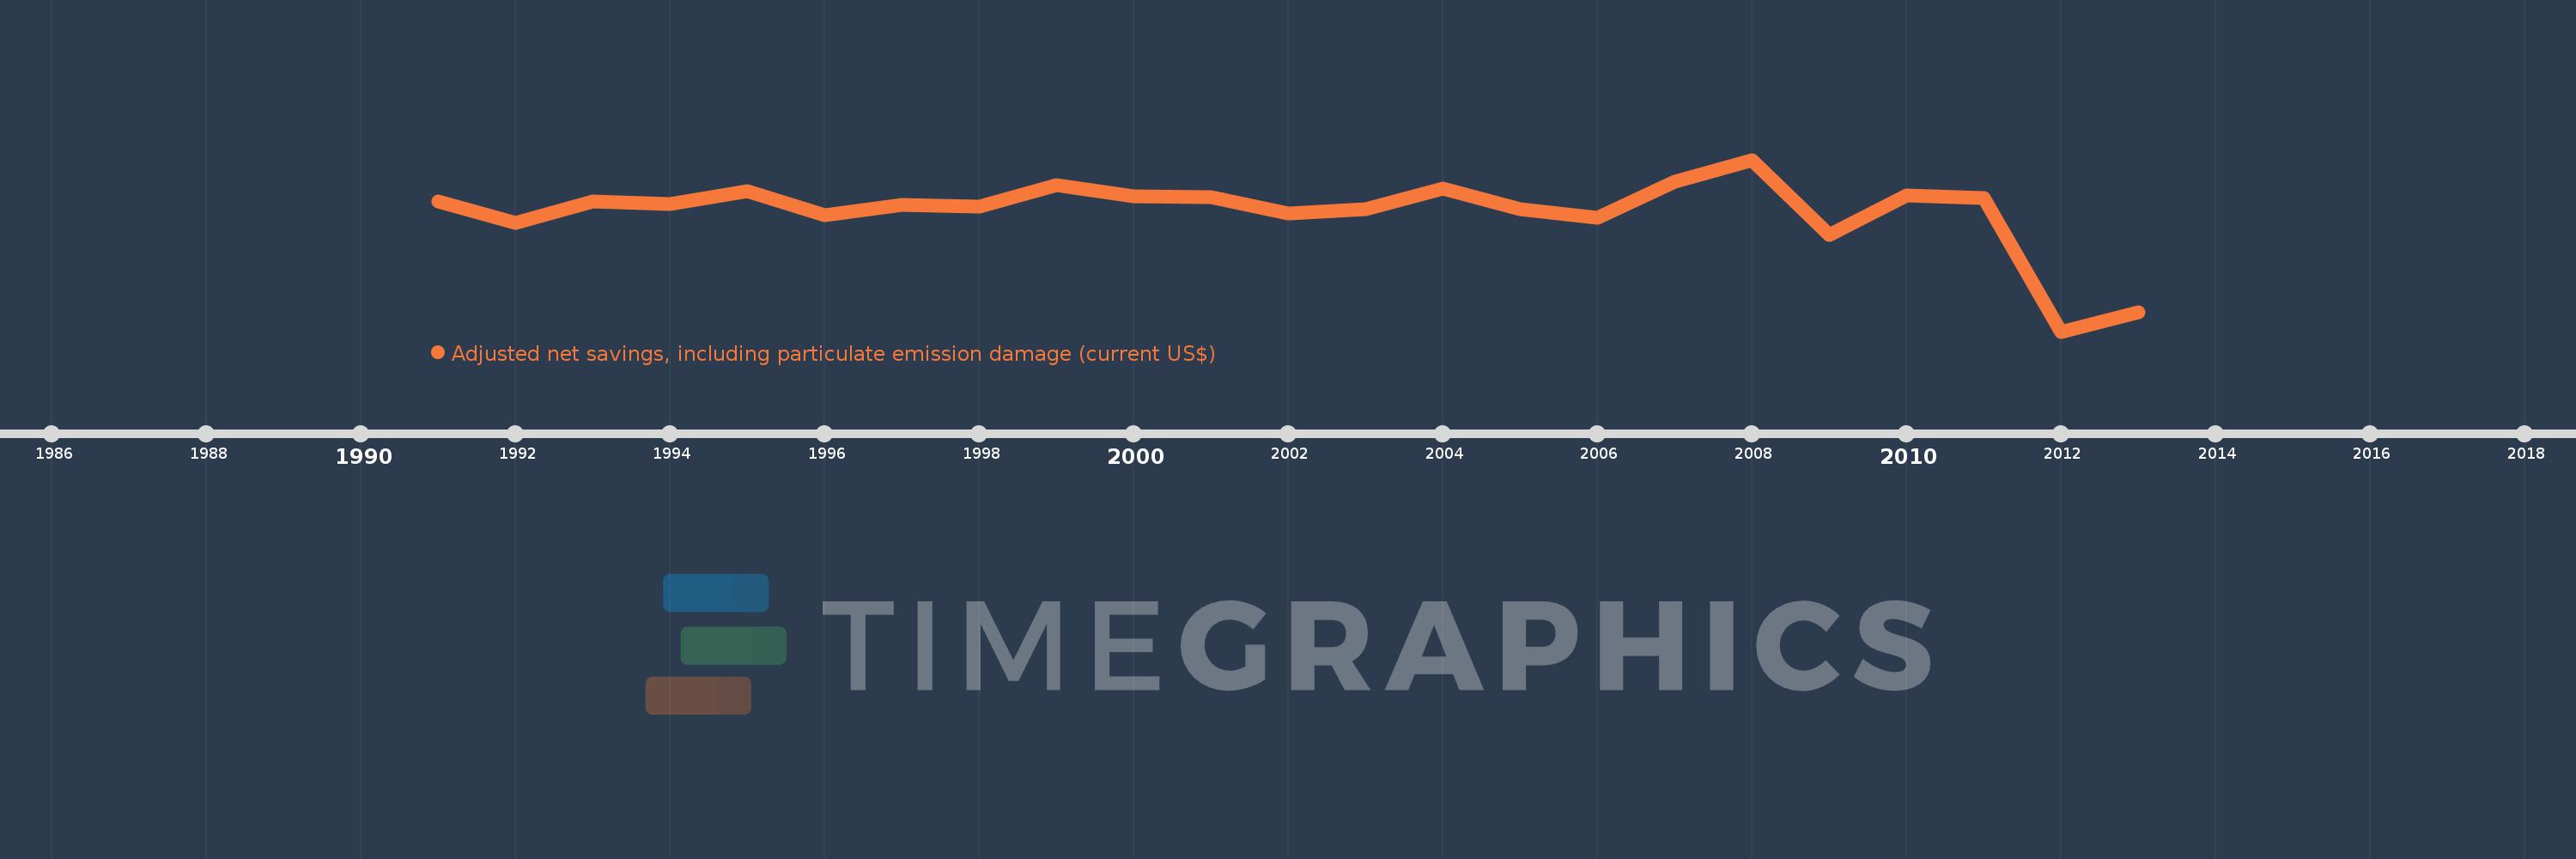
Adjusted net savings, including particulate emission damage (current US$)
2013,2012,2011,2010,2009,2008,2007,2006,2005,2004,2003,2002,2001,2000,1999,1998,1997,1996,1995,1994,1993,1992,1991
This statistics in other country:
AfghanistanAlbaniaAlgeriaAngolaArgentinaArmeniaAustraliaAustriaAzerbaijanBahamas, TheBahrainBangladeshBarbadosBelarusBelgiumBelizeBeninBhutanBoliviaBotswanaBrazilBrunei DarussalamBulgariaBurkina FasoBurundiCabo VerdeCambodiaCameroonCanadaCentral African RepublicChadChileChinaColombiaComorosCongo, Dem. Rep.Congo, Rep.Costa RicaCote d'IvoireCroatiaCyprusCzech RepublicDenmarkDominican RepublicEcuadorEgypt, Arab Rep.El SalvadorEquatorial GuineaEritreaEstoniaEthiopiaFijiFinlandFranceGabonGambia, TheGeorgiaGermanyGhanaGreeceGuatemalaGuineaGuinea-BissauGuyanaHaitiHondurasHungaryIcelandIndiaIndonesiaIran, Islamic Rep.IraqIrelandIsraelItalyJamaicaJapanJordanKazakhstanKenyaKorea, Rep.KuwaitKyrgyz RepublicLao PDRLatviaLebanonLesothoLiberiaLibyaLithuaniaLuxembourgMacedonia, FYRMadagascarMalawiMalaysiaMaldivesMaliMauritaniaMauritiusMexicoMoldovaMongoliaMoroccoMozambiqueNamibiaNepalNetherlandsNew ZealandNicaraguaNigerNigeriaNorwayOmanPakistanPanamaPapua New GuineaParaguayPeruPhilippinesPolandPortugalQatarRomaniaRussian FederationRwandaSaudi ArabiaSenegalSierra LeoneSingaporeSlovak RepublicSloveniaSolomon IslandsSouth AfricaSpainSri LankaSudanSurinameSwazilandSwedenSwitzerlandSyrian Arab RepublicTajikistanTanzaniaThailandTogoTrinidad and TobagoTunisiaTurkeyUgandaUkraineUnited KingdomUnited StatesUruguayVenezuela, RBVietnamYemen, Rep.ZambiaZimbabwe Timeline:
This timeline shows a graph from 1991 to 2013 of Barbados. No data until 1990. Number of actual observations by date: 23.
Source name:
World Development Indicators
Source organization:
World Bank staff estimates based on sources and methods in World Bank's "The Changing Wealth of Nations: Measuring Sustainable Development in the New Millennium" (2011).
Categories, topics:
Economy & Growth, Environment
Last updated:
apr 23, 2017
Indicators value changes by year
Minimum:
-87.953 mln
jan 1, 2012
Maximum:
572.071 mln
jan 1, 2008
At the date of observation
Value
Absolute change
Change from previous value
jan 1, 1991
412.818 mln
+412.818 mln
0.0%
jan 1, 1992
328.846 mln
-83.972 mln
-20.34%
jan 1, 1993
413.158 mln
+84.313 mln
25.64%
jan 1, 1994
401.646 mln
-11.512 mln
-2.79%
jan 1, 1995
453.024 mln
+51.378 mln
12.79%
jan 1, 1996
358.616 mln
-94.409 mln
-20.84%
jan 1, 1997
397.782 mln
+39.166 mln
10.92%
jan 1, 1998
392.824 mln
-4.957 mln
-1.25%
jan 1, 1999
474.626 mln
+81.802 mln
20.82%
jan 1, 2000
431.873 mln
-42.753 mln
-9.01%
jan 1, 2001
428.772 mln
-3.1 mln
-0.72%
jan 1, 2002
364.778 mln
-63.994 mln
-14.93%
jan 1, 2003
382.135 mln
+17.358 mln
4.76%
jan 1, 2004
461.168 mln
+79.033 mln
20.68%
jan 1, 2005
381.394 mln
-79.774 mln
-17.3%
jan 1, 2006
349.131 mln
-32.263 mln
-8.46%
jan 1, 2007
486.551 mln
+137.42 mln
39.36%
jan 1, 2008
572.071 mln
+85.521 mln
17.58%
jan 1, 2009
283.436 mln
-288.635 mln
-50.45%
jan 1, 2010
433.864 mln
+150.428 mln
53.07%
jan 1, 2011
425.347 mln
-8.517 mln
-1.96%
jan 1, 2012
-87.953 mln
-513.3 mln
-120.68%
jan 1, 2013
-13.026 mln
+74.927 mln
-85.19%
Ranking of countries by current statistics by years


Comments: