29
/
en
AIzaSyAYiBZKx7MnpbEhh9jyipgxe19OcubqV5w
April 1, 2024
174987
Latvia
LVA
true
2
1
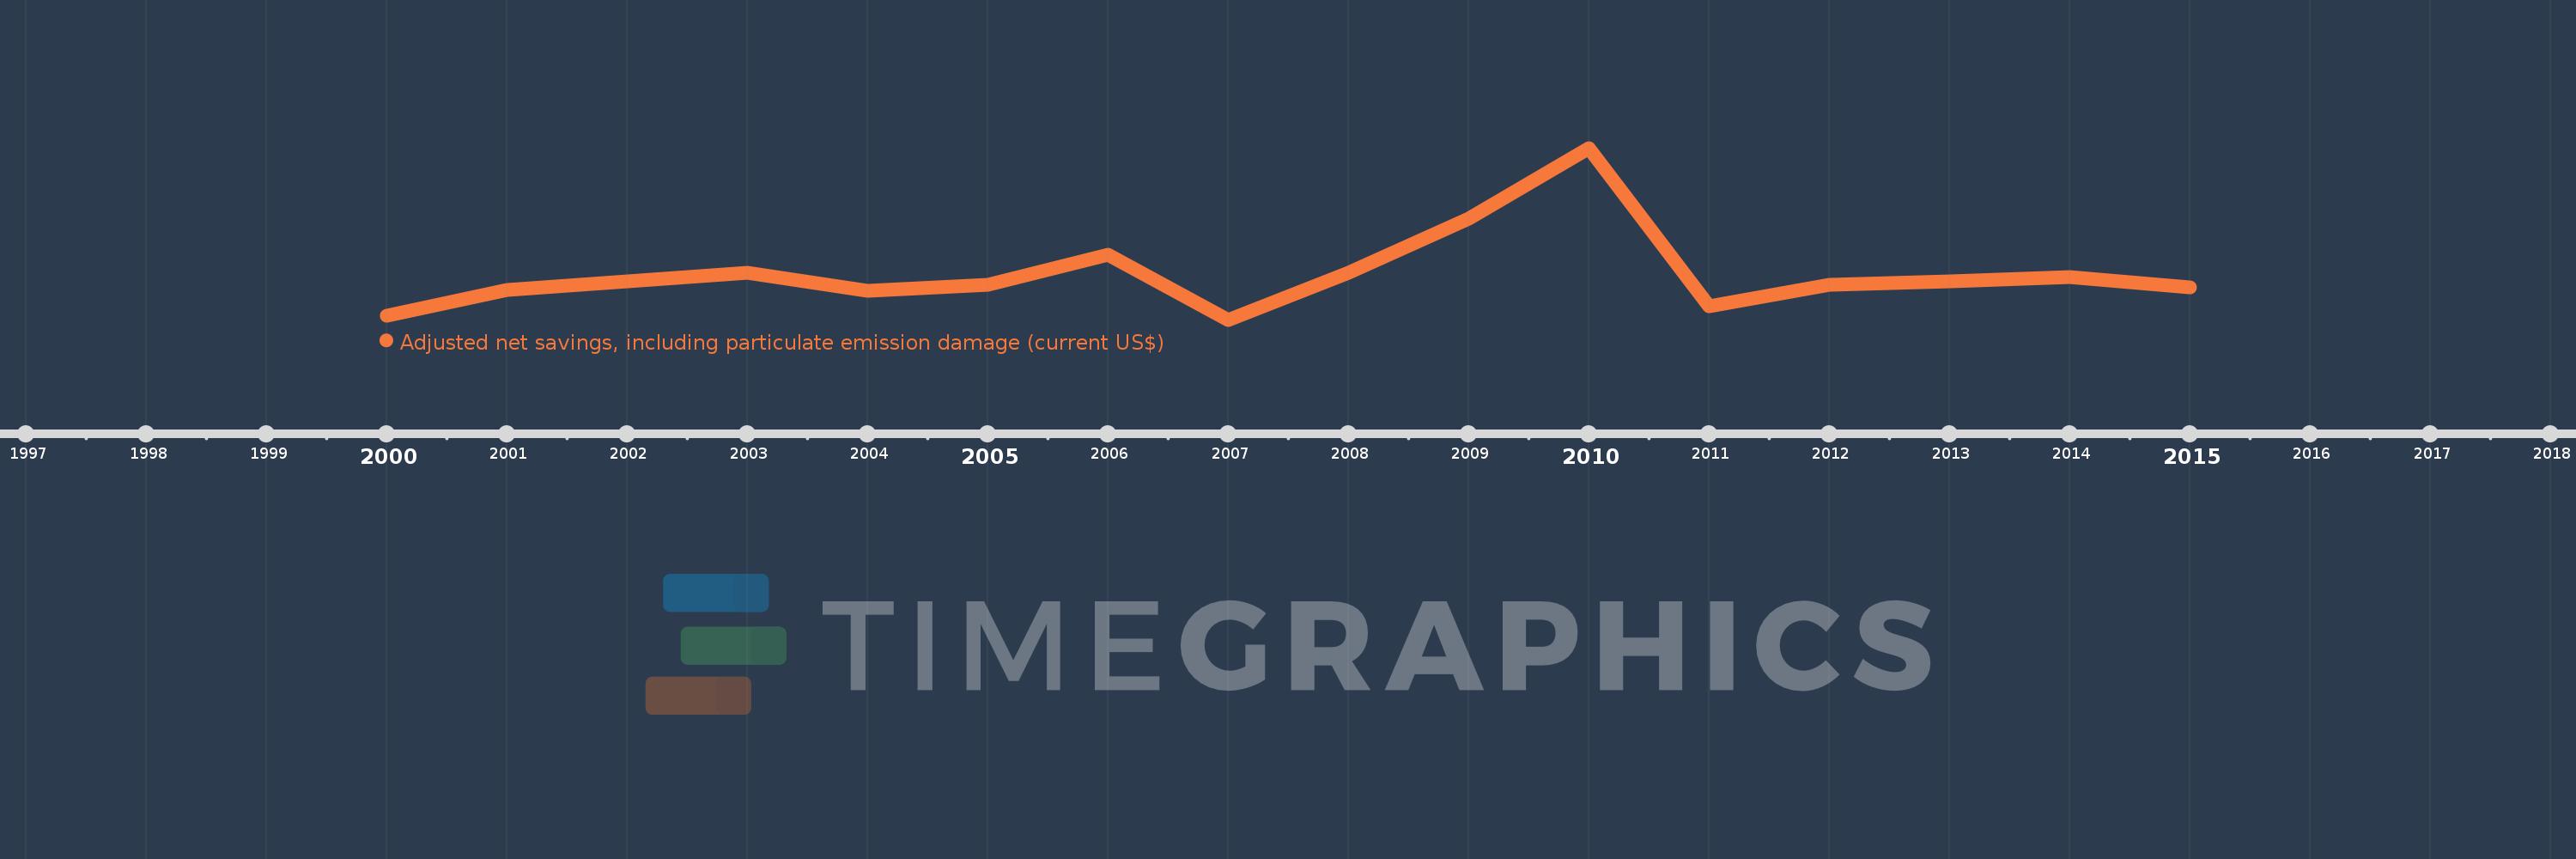
Adjusted net savings, including particulate emission damage (current US$)
2015,2014,2013,2012,2011,2010,2009,2008,2007,2006,2005,2004,2003,2002,2001,2000
This statistics in other country:
AfghanistanAlbaniaAlgeriaAngolaArgentinaArmeniaAustraliaAustriaAzerbaijanBahamas, TheBahrainBangladeshBarbadosBelarusBelgiumBelizeBeninBhutanBoliviaBotswanaBrazilBrunei DarussalamBulgariaBurkina FasoBurundiCabo VerdeCambodiaCameroonCanadaCentral African RepublicChadChileChinaColombiaComorosCongo, Dem. Rep.Congo, Rep.Costa RicaCote d'IvoireCroatiaCyprusCzech RepublicDenmarkDominican RepublicEcuadorEgypt, Arab Rep.El SalvadorEquatorial GuineaEritreaEstoniaEthiopiaFijiFinlandFranceGabonGambia, TheGeorgiaGermanyGhanaGreeceGuatemalaGuineaGuinea-BissauGuyanaHaitiHondurasHungaryIcelandIndiaIndonesiaIran, Islamic Rep.IraqIrelandIsraelItalyJamaicaJapanJordanKazakhstanKenyaKorea, Rep.KuwaitKyrgyz RepublicLao PDRLatviaLebanonLesothoLiberiaLibyaLithuaniaLuxembourgMacedonia, FYRMadagascarMalawiMalaysiaMaldivesMaliMauritaniaMauritiusMexicoMoldovaMongoliaMoroccoMozambiqueNamibiaNepalNetherlandsNew ZealandNicaraguaNigerNigeriaNorwayOmanPakistanPanamaPapua New GuineaParaguayPeruPhilippinesPolandPortugalQatarRomaniaRussian FederationRwandaSaudi ArabiaSenegalSierra LeoneSingaporeSlovak RepublicSloveniaSolomon IslandsSouth AfricaSpainSri LankaSudanSurinameSwazilandSwedenSwitzerlandSyrian Arab RepublicTajikistanTanzaniaThailandTogoTrinidad and TobagoTunisiaTurkeyUgandaUkraineUnited KingdomUnited StatesUruguayVenezuela, RBVietnamYemen, Rep.ZambiaZimbabwe Timeline:
This timeline shows a graph from 2000 to 2015 of Latvia. No data until 1999. Number of actual observations by date: 16.
Source name:
World Development Indicators
Source organization:
World Bank staff estimates based on sources and methods in World Bank's "The Changing Wealth of Nations: Measuring Sustainable Development in the New Millennium" (2011).
Categories, topics:
Economy & Growth, Environment
Last updated:
apr 23, 2017
Indicators value changes by year
Minimum:
-477.871 mln
jan 1, 2007
Maximum:
2.464 bln
jan 1, 2010
At the date of observation
Value
Absolute change
Change from previous value
jan 1, 2000
-412.23 mln
-412.23 mln
0.0%
jan 1, 2001
35.491 mln
+447.721 mln
-108.61%
jan 1, 2002
176.659 mln
+141.168 mln
397.76%
jan 1, 2003
321.613 mln
+144.954 mln
82.05%
jan 1, 2004
13.879 mln
-307.734 mln
-95.68%
jan 1, 2005
127.376 mln
+113.497 mln
817.79%
jan 1, 2006
639.771 mln
+512.395 mln
402.27%
jan 1, 2007
-477.871 mln
-1.118 bln
-174.69%
jan 1, 2008
332.508 mln
+810.379 mln
-169.58%
jan 1, 2009
1.26 bln
+927.463 mln
278.93%
jan 1, 2010
2.464 bln
+1.204 bln
95.57%
jan 1, 2011
-245.486 mln
-2.71 bln
-109.96%
jan 1, 2012
123.856 mln
+369.342 mln
-150.45%
jan 1, 2013
172.471 mln
+48.615 mln
39.25%
jan 1, 2014
256.165 mln
+83.693 mln
48.53%
jan 1, 2015
70.271 mln
-185.894 mln
-72.57%
Ranking of countries by current statistics by years


Comments: