29
/
en
AIzaSyAYiBZKx7MnpbEhh9jyipgxe19OcubqV5w
April 1, 2024
234350
Saudi Arabia
SAU
true
2
1
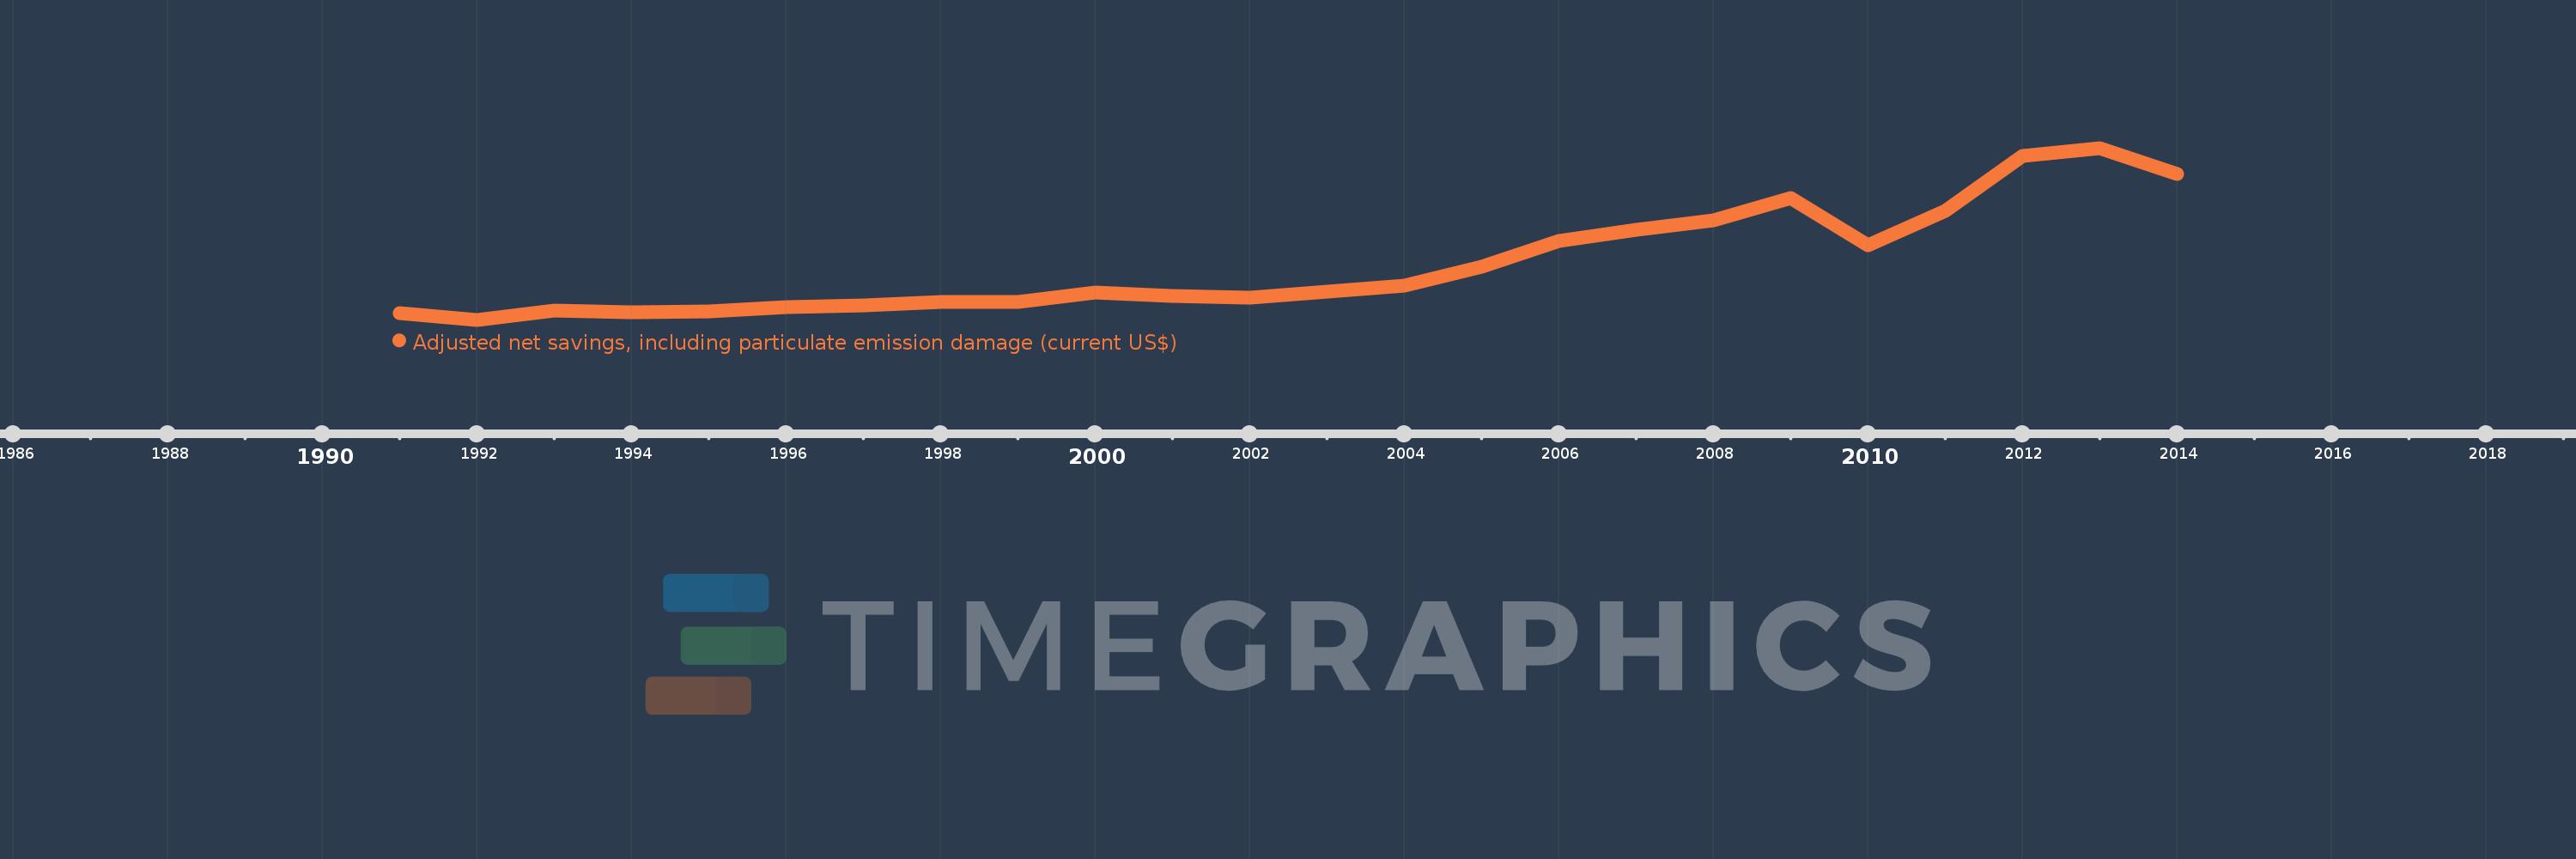
Adjusted net savings, including particulate emission damage (current US$)
2014,2013,2012,2011,2010,2009,2008,2007,2006,2005,2004,2003,2002,2001,2000,1999,1998,1997,1996,1995,1994,1993,1992,1991
This statistics in other country:
AfghanistanAlbaniaAlgeriaAngolaArgentinaArmeniaAustraliaAustriaAzerbaijanBahamas, TheBahrainBangladeshBarbadosBelarusBelgiumBelizeBeninBhutanBoliviaBotswanaBrazilBrunei DarussalamBulgariaBurkina FasoBurundiCabo VerdeCambodiaCameroonCanadaCentral African RepublicChadChileChinaColombiaComorosCongo, Dem. Rep.Congo, Rep.Costa RicaCote d'IvoireCroatiaCyprusCzech RepublicDenmarkDominican RepublicEcuadorEgypt, Arab Rep.El SalvadorEquatorial GuineaEritreaEstoniaEthiopiaFijiFinlandFranceGabonGambia, TheGeorgiaGermanyGhanaGreeceGuatemalaGuineaGuinea-BissauGuyanaHaitiHondurasHungaryIcelandIndiaIndonesiaIran, Islamic Rep.IraqIrelandIsraelItalyJamaicaJapanJordanKazakhstanKenyaKorea, Rep.KuwaitKyrgyz RepublicLao PDRLatviaLebanonLesothoLiberiaLibyaLithuaniaLuxembourgMacedonia, FYRMadagascarMalawiMalaysiaMaldivesMaliMauritaniaMauritiusMexicoMoldovaMongoliaMoroccoMozambiqueNamibiaNepalNetherlandsNew ZealandNicaraguaNigerNigeriaNorwayOmanPakistanPanamaPapua New GuineaParaguayPeruPhilippinesPolandPortugalQatarRomaniaRussian FederationRwandaSaudi ArabiaSenegalSierra LeoneSingaporeSlovak RepublicSloveniaSolomon IslandsSouth AfricaSpainSri LankaSudanSurinameSwazilandSwedenSwitzerlandSyrian Arab RepublicTajikistanTanzaniaThailandTogoTrinidad and TobagoTunisiaTurkeyUgandaUkraineUnited KingdomUnited StatesUruguayVenezuela, RBVietnamYemen, Rep.ZambiaZimbabwe Timeline:
This timeline shows a graph from 1991 to 2014 of Saudi Arabia. No data until 1990. Number of actual observations by date: 24.
Source name:
World Development Indicators
Source organization:
World Bank staff estimates based on sources and methods in World Bank's "The Changing Wealth of Nations: Measuring Sustainable Development in the New Millennium" (2011).
Categories, topics:
Economy & Growth, Environment
Last updated:
apr 23, 2017
Indicators value changes by year
Minimum:
-14.603 bln
jan 1, 1992
Maximum:
180.829 bln
jan 1, 2013
At the date of observation
Value
Absolute change
Change from previous value
jan 1, 1991
-6.668 bln
-6.668 bln
0.0%
jan 1, 1992
-14.603 bln
-7.935 bln
118.99%
jan 1, 1993
-4.246 bln
+10.357 bln
-70.92%
jan 1, 1994
-5.743 bln
-1.496 bln
35.24%
jan 1, 1995
-5.161 bln
+581.361 mln
-10.12%
jan 1, 1996
-197.161 mln
+4.964 bln
-96.18%
jan 1, 1997
1.943 bln
+2.14 bln
-1.09K%
jan 1, 1998
5.76 bln
+3.817 bln
196.46%
jan 1, 1999
5.433 bln
-326.753 mln
-5.67%
jan 1, 2000
16.284 bln
+10.85 bln
199.7%
jan 1, 2001
12.223 bln
-4.061 bln
-24.94%
jan 1, 2002
10.69 bln
-1.532 bln
-12.54%
jan 1, 2003
17.107 bln
+6.417 bln
60.03%
jan 1, 2004
24.628 bln
+7.52 bln
43.96%
jan 1, 2005
45.875 bln
+21.248 bln
86.28%
jan 1, 2006
74.942 bln
+29.067 bln
63.36%
jan 1, 2007
87.752 bln
+12.81 bln
17.09%
jan 1, 2008
98.838 bln
+11.085 bln
12.63%
jan 1, 2009
124.219 bln
+25.382 bln
25.68%
jan 1, 2010
69.783 bln
-54.436 bln
-43.82%
jan 1, 2011
108.859 bln
+39.077 bln
56.0%
jan 1, 2012
171.328 bln
+62.469 bln
57.38%
jan 1, 2013
180.829 bln
+9.501 bln
5.55%
jan 1, 2014
151.366 bln
-29.463 bln
-16.29%
Ranking of countries by current statistics by years


Comments: