29
/
en
AIzaSyAYiBZKx7MnpbEhh9jyipgxe19OcubqV5w
April 1, 2024
106809
Colombia
COL
true
2
1
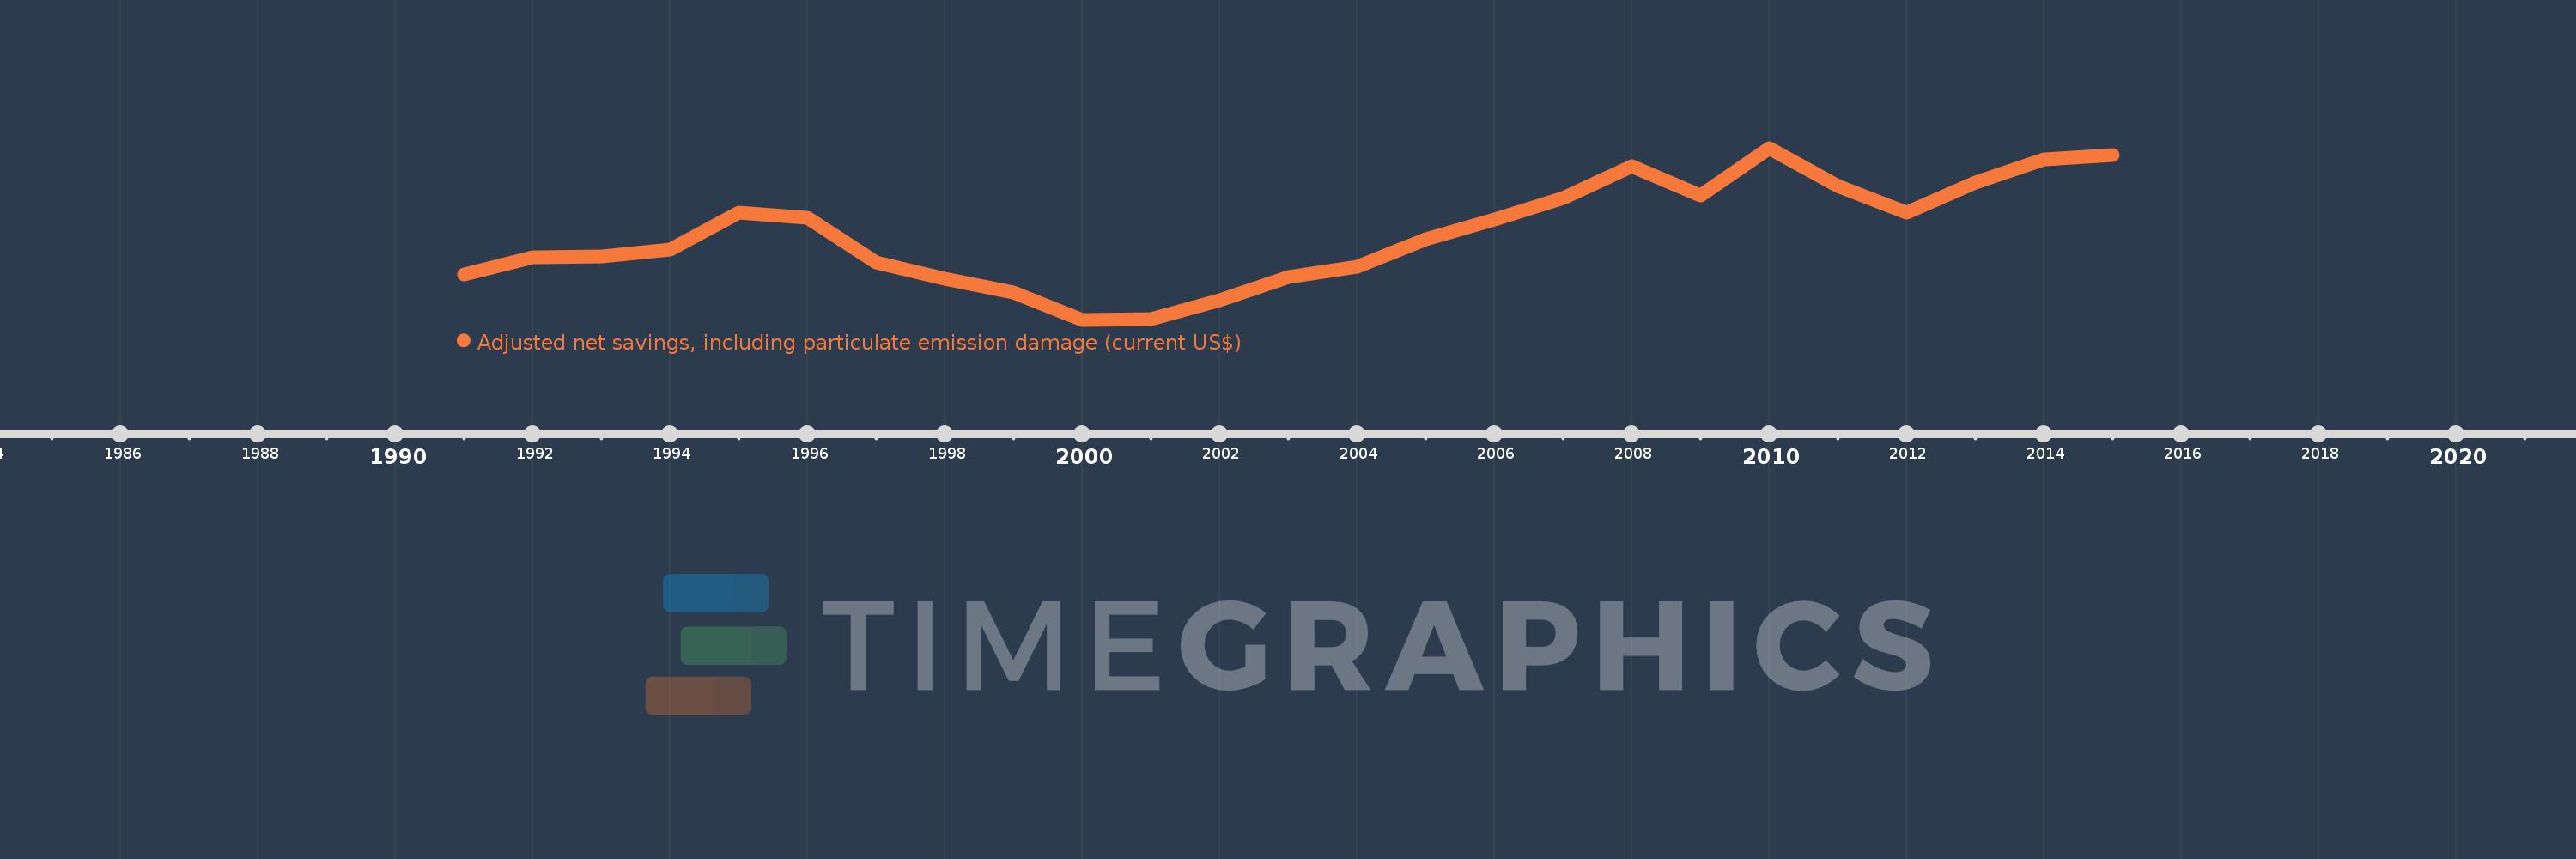
Adjusted net savings, including particulate emission damage (current US$)
2015,2014,2013,2012,2011,2010,2009,2008,2007,2006,2005,2004,2003,2002,2001,2000,1999,1998,1997,1996,1995,1994,1993,1992,1991
This statistics in other country:
AfghanistanAlbaniaAlgeriaAngolaArgentinaArmeniaAustraliaAustriaAzerbaijanBahamas, TheBahrainBangladeshBarbadosBelarusBelgiumBelizeBeninBhutanBoliviaBotswanaBrazilBrunei DarussalamBulgariaBurkina FasoBurundiCabo VerdeCambodiaCameroonCanadaCentral African RepublicChadChileChinaColombiaComorosCongo, Dem. Rep.Congo, Rep.Costa RicaCote d'IvoireCroatiaCyprusCzech RepublicDenmarkDominican RepublicEcuadorEgypt, Arab Rep.El SalvadorEquatorial GuineaEritreaEstoniaEthiopiaFijiFinlandFranceGabonGambia, TheGeorgiaGermanyGhanaGreeceGuatemalaGuineaGuinea-BissauGuyanaHaitiHondurasHungaryIcelandIndiaIndonesiaIran, Islamic Rep.IraqIrelandIsraelItalyJamaicaJapanJordanKazakhstanKenyaKorea, Rep.KuwaitKyrgyz RepublicLao PDRLatviaLebanonLesothoLiberiaLibyaLithuaniaLuxembourgMacedonia, FYRMadagascarMalawiMalaysiaMaldivesMaliMauritaniaMauritiusMexicoMoldovaMongoliaMoroccoMozambiqueNamibiaNepalNetherlandsNew ZealandNicaraguaNigerNigeriaNorwayOmanPakistanPanamaPapua New GuineaParaguayPeruPhilippinesPolandPortugalQatarRomaniaRussian FederationRwandaSaudi ArabiaSenegalSierra LeoneSingaporeSlovak RepublicSloveniaSolomon IslandsSouth AfricaSpainSri LankaSudanSurinameSwazilandSwedenSwitzerlandSyrian Arab RepublicTajikistanTanzaniaThailandTogoTrinidad and TobagoTunisiaTurkeyUgandaUkraineUnited KingdomUnited StatesUruguayVenezuela, RBVietnamYemen, Rep.ZambiaZimbabwe Timeline:
This timeline shows a graph from 1991 to 2015 of Colombia. No data until 1990. Number of actual observations by date: 25.
Source name:
World Development Indicators
Source organization:
World Bank staff estimates based on sources and methods in World Bank's "The Changing Wealth of Nations: Measuring Sustainable Development in the New Millennium" (2011).
Categories, topics:
Economy & Growth, Environment
Last updated:
apr 23, 2017
Indicators value changes by year
Minimum:
-3.616 bln
jan 1, 2000
Maximum:
12.879 bln
jan 1, 2010
At the date of observation
Value
Absolute change
Change from previous value
jan 1, 1991
733.43 mln
+733.43 mln
0.0%
jan 1, 1992
2.394 bln
+1.66 bln
226.36%
jan 1, 1993
2.48 bln
+86.394 mln
3.61%
jan 1, 1994
3.153 bln
+672.663 mln
27.12%
jan 1, 1995
6.634 bln
+3.481 bln
110.41%
jan 1, 1996
6.197 bln
-436.403 mln
-6.58%
jan 1, 1997
1.899 bln
-4.298 bln
-69.36%
jan 1, 1998
299.913 mln
-1.599 bln
-84.2%
jan 1, 1999
-996.697 mln
-1.297 bln
-432.33%
jan 1, 2000
-3.616 bln
-2.619 bln
262.79%
jan 1, 2001
-3.579 bln
+37.161 mln
-1.03%
jan 1, 2002
-1.759 bln
+1.82 bln
-50.85%
jan 1, 2003
474.493 mln
+2.233 bln
-126.98%
jan 1, 2004
1.438 bln
+963.263 mln
203.01%
jan 1, 2005
4.132 bln
+2.695 bln
187.42%
jan 1, 2006
5.999 bln
+1.867 bln
45.18%
jan 1, 2007
8.076 bln
+2.077 bln
34.62%
jan 1, 2008
11.151 bln
+3.074 bln
38.07%
jan 1, 2009
8.357 bln
-2.794 bln
-25.05%
jan 1, 2010
12.879 bln
+4.521 bln
54.1%
jan 1, 2011
9.195 bln
-3.684 bln
-28.61%
jan 1, 2012
6.698 bln
-2.497 bln
-27.15%
jan 1, 2013
9.563 bln
+2.865 bln
42.78%
jan 1, 2014
11.794 bln
+2.231 bln
23.33%
jan 1, 2015
12.154 bln
+360.252 mln
3.05%
Ranking of countries by current statistics by years


Comments: