29
/
en
AIzaSyAYiBZKx7MnpbEhh9jyipgxe19OcubqV5w
April 1, 2024
155535
Indonesia
IDN
true
2
1
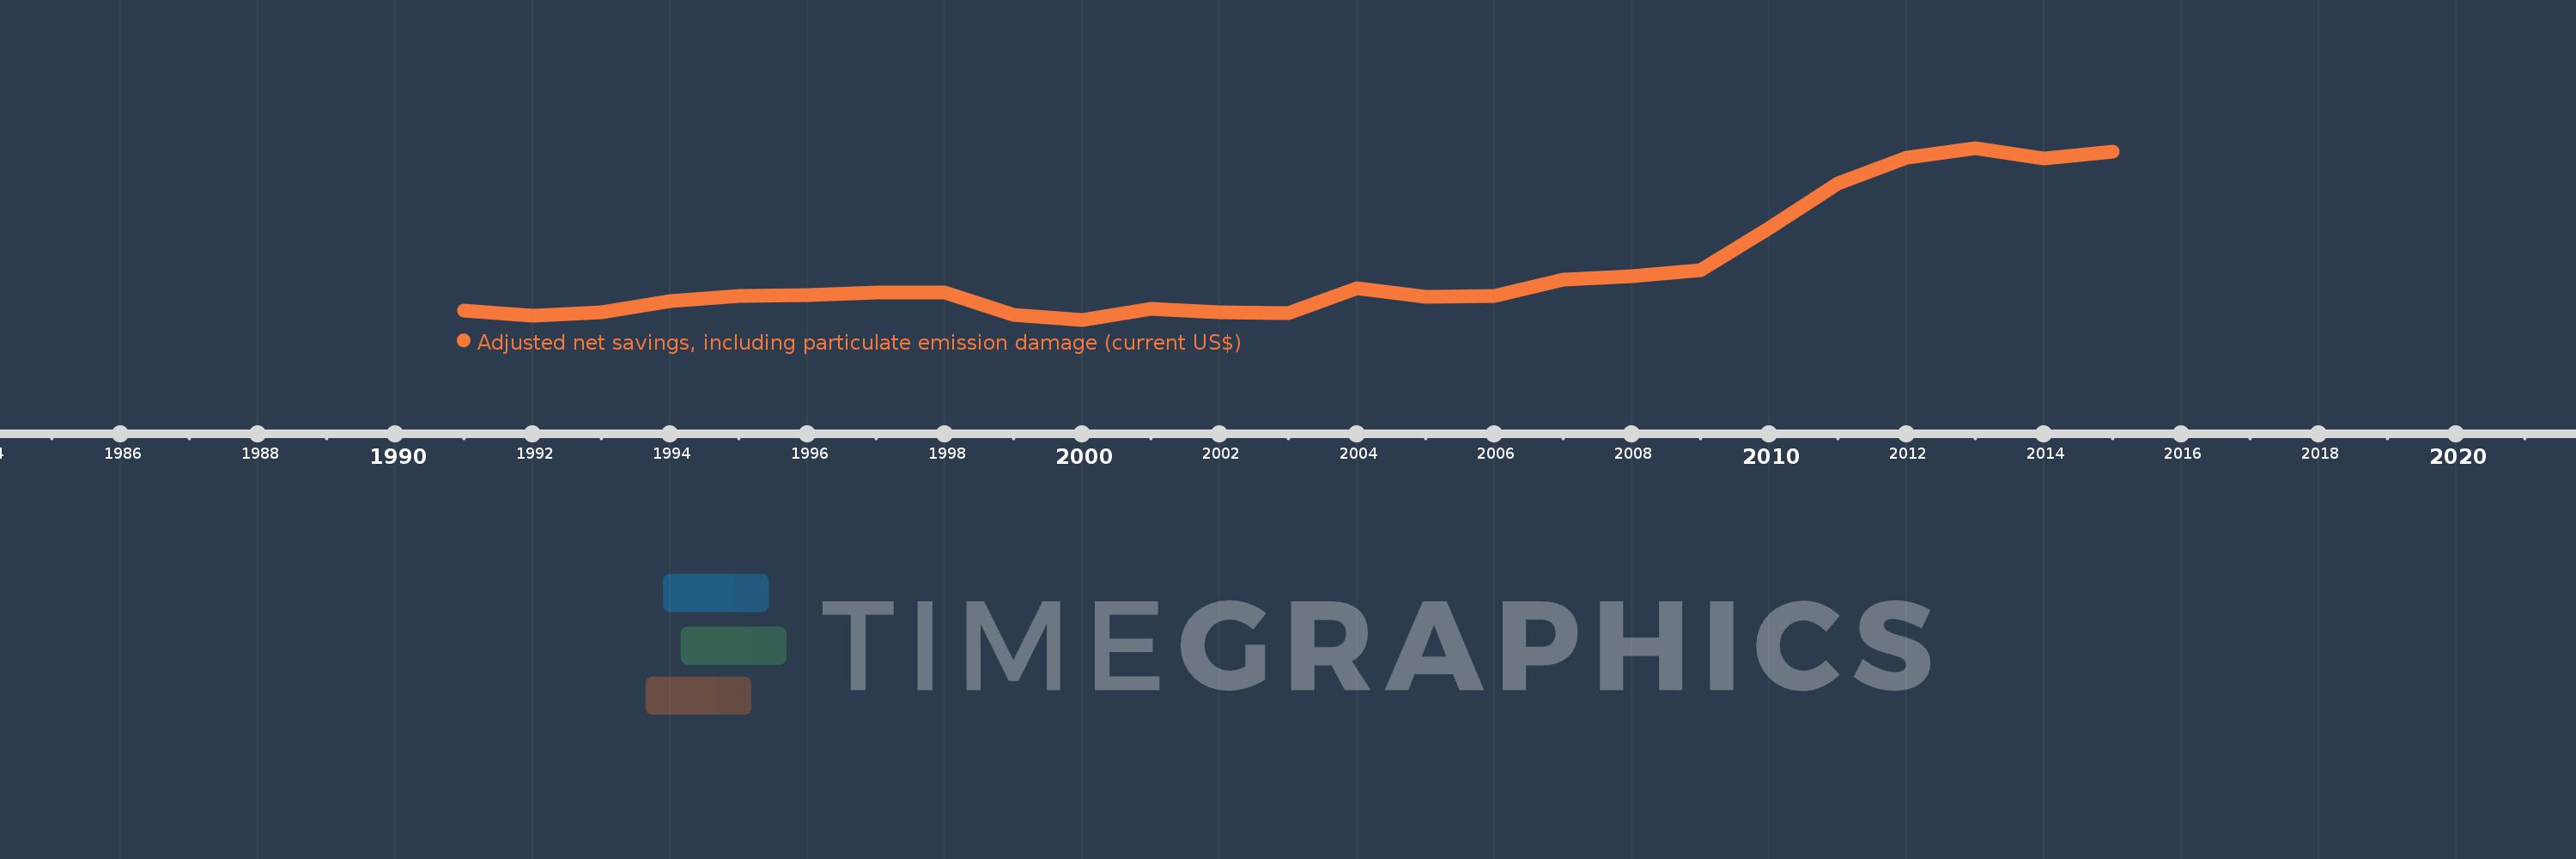
Adjusted net savings, including particulate emission damage (current US$)
2015,2014,2013,2012,2011,2010,2009,2008,2007,2006,2005,2004,2003,2002,2001,2000,1999,1998,1997,1996,1995,1994,1993,1992,1991
This statistics in other country:
AfghanistanAlbaniaAlgeriaAngolaArgentinaArmeniaAustraliaAustriaAzerbaijanBahamas, TheBahrainBangladeshBarbadosBelarusBelgiumBelizeBeninBhutanBoliviaBotswanaBrazilBrunei DarussalamBulgariaBurkina FasoBurundiCabo VerdeCambodiaCameroonCanadaCentral African RepublicChadChileChinaColombiaComorosCongo, Dem. Rep.Congo, Rep.Costa RicaCote d'IvoireCroatiaCyprusCzech RepublicDenmarkDominican RepublicEcuadorEgypt, Arab Rep.El SalvadorEquatorial GuineaEritreaEstoniaEthiopiaFijiFinlandFranceGabonGambia, TheGeorgiaGermanyGhanaGreeceGuatemalaGuineaGuinea-BissauGuyanaHaitiHondurasHungaryIcelandIndiaIndonesiaIran, Islamic Rep.IraqIrelandIsraelItalyJamaicaJapanJordanKazakhstanKenyaKorea, Rep.KuwaitKyrgyz RepublicLao PDRLatviaLebanonLesothoLiberiaLibyaLithuaniaLuxembourgMacedonia, FYRMadagascarMalawiMalaysiaMaldivesMaliMauritaniaMauritiusMexicoMoldovaMongoliaMoroccoMozambiqueNamibiaNepalNetherlandsNew ZealandNicaraguaNigerNigeriaNorwayOmanPakistanPanamaPapua New GuineaParaguayPeruPhilippinesPolandPortugalQatarRomaniaRussian FederationRwandaSaudi ArabiaSenegalSierra LeoneSingaporeSlovak RepublicSloveniaSolomon IslandsSouth AfricaSpainSri LankaSudanSurinameSwazilandSwedenSwitzerlandSyrian Arab RepublicTajikistanTanzaniaThailandTogoTrinidad and TobagoTunisiaTurkeyUgandaUkraineUnited KingdomUnited StatesUruguayVenezuela, RBVietnamYemen, Rep.ZambiaZimbabwe Timeline:
This timeline shows a graph from 1991 to 2015 of Indonesia. No data until 1990. Number of actual observations by date: 25.
Source name:
World Development Indicators
Source organization:
World Bank staff estimates based on sources and methods in World Bank's "The Changing Wealth of Nations: Measuring Sustainable Development in the New Millennium" (2011).
Categories, topics:
Economy & Growth, Environment
Last updated:
apr 23, 2017
Indicators value changes by year
Minimum:
3.564 bln
jan 1, 2000
Maximum:
231.155 bln
jan 1, 2013
At the date of observation
Value
Absolute change
Change from previous value
jan 1, 1991
15.969 bln
+15.969 bln
0.0%
jan 1, 1992
9.442 bln
-6.527 bln
-40.87%
jan 1, 1993
13.558 bln
+4.117 bln
43.6%
jan 1, 1994
28.793 bln
+15.235 bln
112.37%
jan 1, 1995
34.655 bln
+5.861 bln
20.36%
jan 1, 1996
36.478 bln
+1.823 bln
5.26%
jan 1, 1997
39.112 bln
+2.634 bln
7.22%
jan 1, 1998
40.055 bln
+943.014 mln
2.41%
jan 1, 1999
9.803 bln
-30.251 bln
-75.53%
jan 1, 2000
3.564 bln
-6.24 bln
-63.65%
jan 1, 2001
17.777 bln
+14.214 bln
398.86%
jan 1, 2002
13.715 bln
-4.063 bln
-22.85%
jan 1, 2003
12.135 bln
-1.58 bln
-11.52%
jan 1, 2004
45.252 bln
+33.117 bln
272.91%
jan 1, 2005
33.682 bln
-11.57 bln
-25.57%
jan 1, 2006
34.969 bln
+1.287 bln
3.82%
jan 1, 2007
56.993 bln
+22.024 bln
62.98%
jan 1, 2008
61.371 bln
+4.378 bln
7.68%
jan 1, 2009
68.815 bln
+7.444 bln
12.13%
jan 1, 2010
125.381 bln
+56.566 bln
82.2%
jan 1, 2011
183.672 bln
+58.291 bln
46.49%
jan 1, 2012
218.835 bln
+35.163 bln
19.14%
jan 1, 2013
231.155 bln
+12.32 bln
5.63%
jan 1, 2014
217.625 bln
-13.53 bln
-5.85%
jan 1, 2015
226.616 bln
+8.992 bln
4.13%
Ranking of countries by current statistics by years


Comments: