29
/
en
AIzaSyAYiBZKx7MnpbEhh9jyipgxe19OcubqV5w
April 1, 2024
163465
Japan
JPN
true
2
1
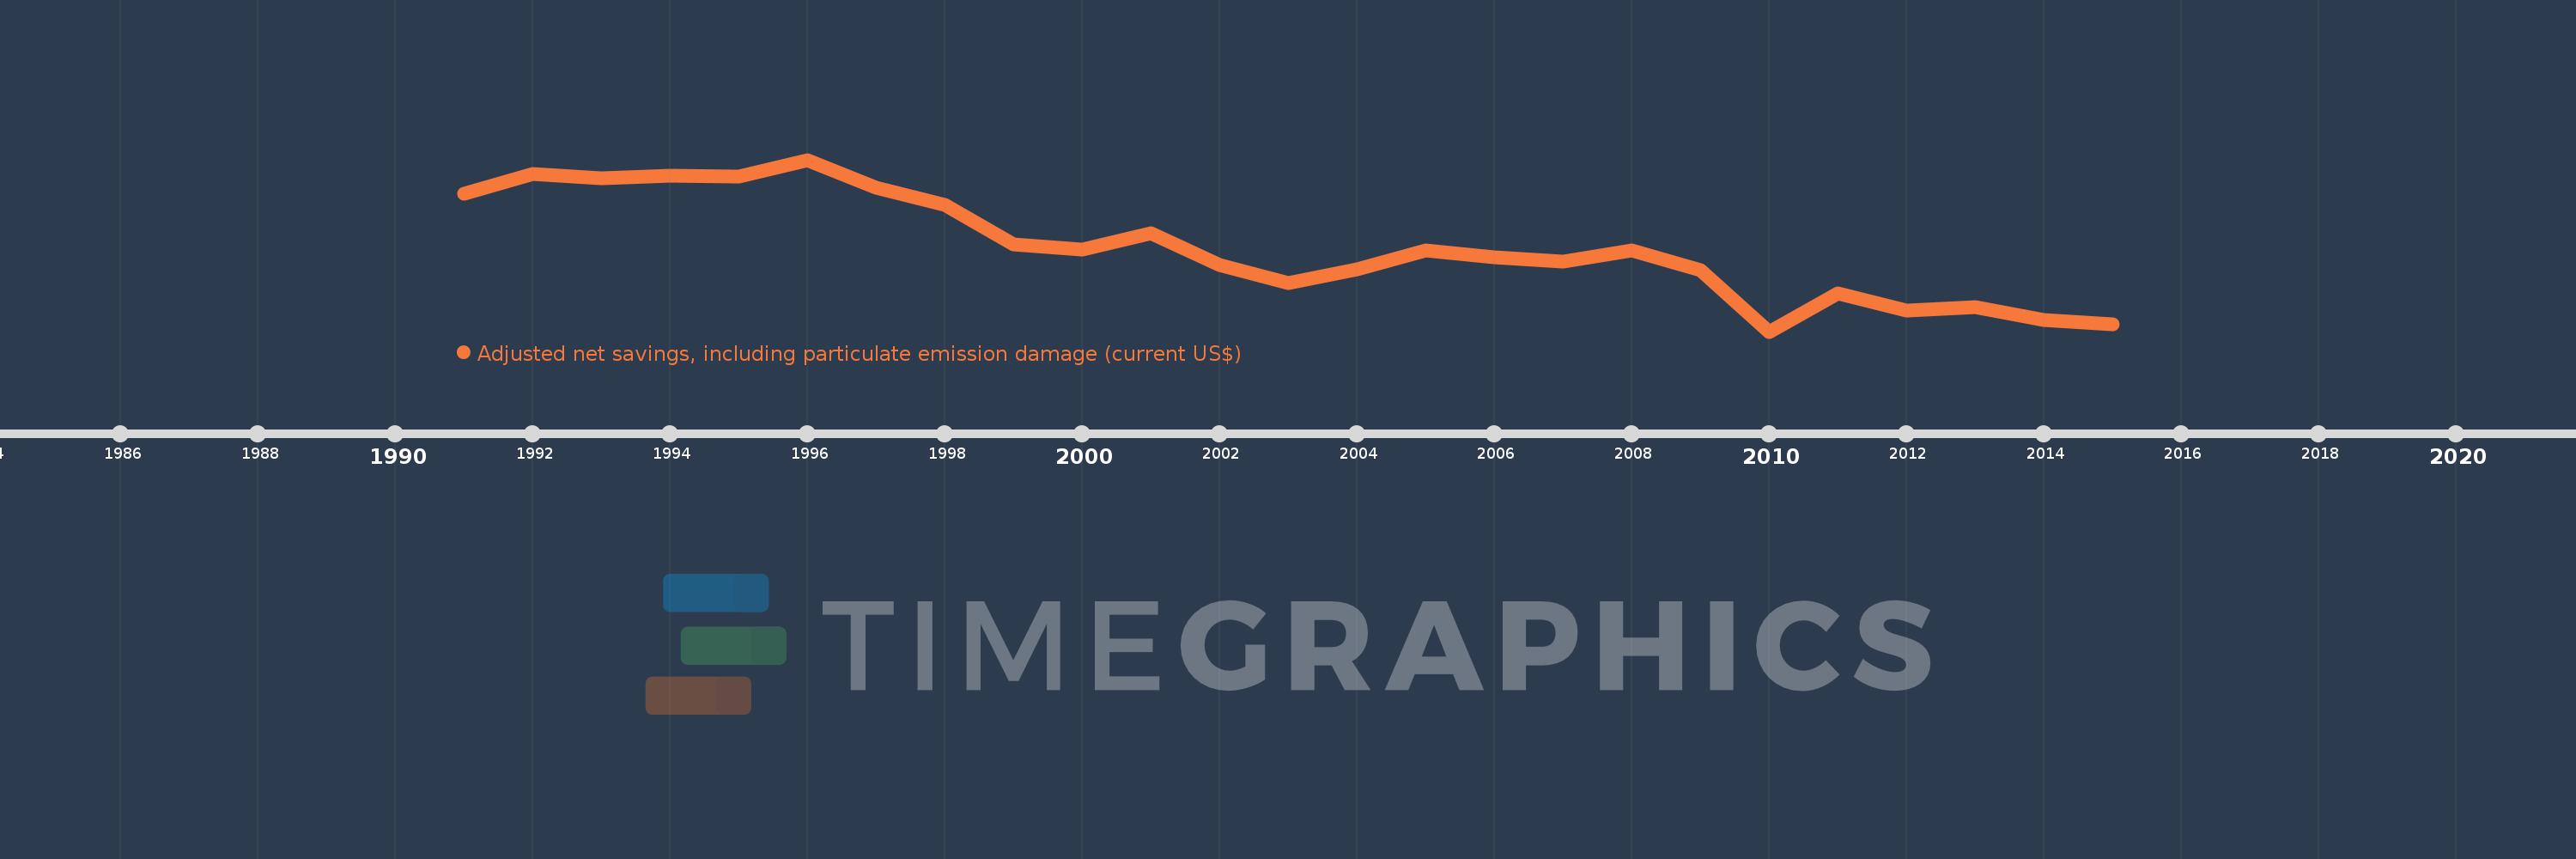
Adjusted net savings, including particulate emission damage (current US$)
2015,2014,2013,2012,2011,2010,2009,2008,2007,2006,2005,2004,2003,2002,2001,2000,1999,1998,1997,1996,1995,1994,1993,1992,1991
This statistics in other country:
AfghanistanAlbaniaAlgeriaAngolaArgentinaArmeniaAustraliaAustriaAzerbaijanBahamas, TheBahrainBangladeshBarbadosBelarusBelgiumBelizeBeninBhutanBoliviaBotswanaBrazilBrunei DarussalamBulgariaBurkina FasoBurundiCabo VerdeCambodiaCameroonCanadaCentral African RepublicChadChileChinaColombiaComorosCongo, Dem. Rep.Congo, Rep.Costa RicaCote d'IvoireCroatiaCyprusCzech RepublicDenmarkDominican RepublicEcuadorEgypt, Arab Rep.El SalvadorEquatorial GuineaEritreaEstoniaEthiopiaFijiFinlandFranceGabonGambia, TheGeorgiaGermanyGhanaGreeceGuatemalaGuineaGuinea-BissauGuyanaHaitiHondurasHungaryIcelandIndiaIndonesiaIran, Islamic Rep.IraqIrelandIsraelItalyJamaicaJapanJordanKazakhstanKenyaKorea, Rep.KuwaitKyrgyz RepublicLao PDRLatviaLebanonLesothoLiberiaLibyaLithuaniaLuxembourgMacedonia, FYRMadagascarMalawiMalaysiaMaldivesMaliMauritaniaMauritiusMexicoMoldovaMongoliaMoroccoMozambiqueNamibiaNepalNetherlandsNew ZealandNicaraguaNigerNigeriaNorwayOmanPakistanPanamaPapua New GuineaParaguayPeruPhilippinesPolandPortugalQatarRomaniaRussian FederationRwandaSaudi ArabiaSenegalSierra LeoneSingaporeSlovak RepublicSloveniaSolomon IslandsSouth AfricaSpainSri LankaSudanSurinameSwazilandSwedenSwitzerlandSyrian Arab RepublicTajikistanTanzaniaThailandTogoTrinidad and TobagoTunisiaTurkeyUgandaUkraineUnited KingdomUnited StatesUruguayVenezuela, RBVietnamYemen, Rep.ZambiaZimbabwe Timeline:
This timeline shows a graph from 1991 to 2015 of Japan. No data until 1990. Number of actual observations by date: 25.
Source name:
World Development Indicators
Source organization:
World Bank staff estimates based on sources and methods in World Bank's "The Changing Wealth of Nations: Measuring Sustainable Development in the New Millennium" (2011).
Categories, topics:
Economy & Growth, Environment
Last updated:
apr 23, 2017
Indicators value changes by year
Minimum:
136.036 bln
jan 1, 2010
Maximum:
741.95 bln
jan 1, 1996
At the date of observation
Value
Absolute change
Change from previous value
jan 1, 1991
621.46 bln
+621.46 bln
0.0%
jan 1, 1992
691.956 bln
+70.496 bln
11.34%
jan 1, 1993
676.022 bln
-15.934 bln
-2.3%
jan 1, 1994
687.188 bln
+11.166 bln
1.65%
jan 1, 1995
682.883 bln
-4.304 bln
-0.63%
jan 1, 1996
741.95 bln
+59.066 bln
8.65%
jan 1, 1997
644.975 bln
-96.975 bln
-13.07%
jan 1, 1998
583.357 bln
-61.617 bln
-9.55%
jan 1, 1999
442.616 bln
-140.741 bln
-24.13%
jan 1, 2000
424.492 bln
-18.124 bln
-4.09%
jan 1, 2001
484.164 bln
+59.672 bln
14.06%
jan 1, 2002
371.963 bln
-112.201 bln
-23.17%
jan 1, 2003
307.247 bln
-64.715 bln
-17.4%
jan 1, 2004
356.359 bln
+49.111 bln
15.98%
jan 1, 2005
421.358 bln
+65.0 bln
18.24%
jan 1, 2006
399.341 bln
-22.017 bln
-5.23%
jan 1, 2007
382.896 bln
-16.445 bln
-4.12%
jan 1, 2008
422.851 bln
+39.955 bln
10.43%
jan 1, 2009
352.153 bln
-70.698 bln
-16.72%
jan 1, 2010
136.036 bln
-216.118 bln
-61.37%
jan 1, 2011
270.522 bln
+134.487 bln
98.86%
jan 1, 2012
210.437 bln
-60.086 bln
-22.21%
jan 1, 2013
223.214 bln
+12.777 bln
6.07%
jan 1, 2014
176.364 bln
-46.85 bln
-20.99%
jan 1, 2015
161.915 bln
-14.449 bln
-8.19%
Ranking of countries by current statistics by years


Comments: