29
/
en
AIzaSyAYiBZKx7MnpbEhh9jyipgxe19OcubqV5w
April 1, 2024
145286
Guinea
GIN
true
2
1
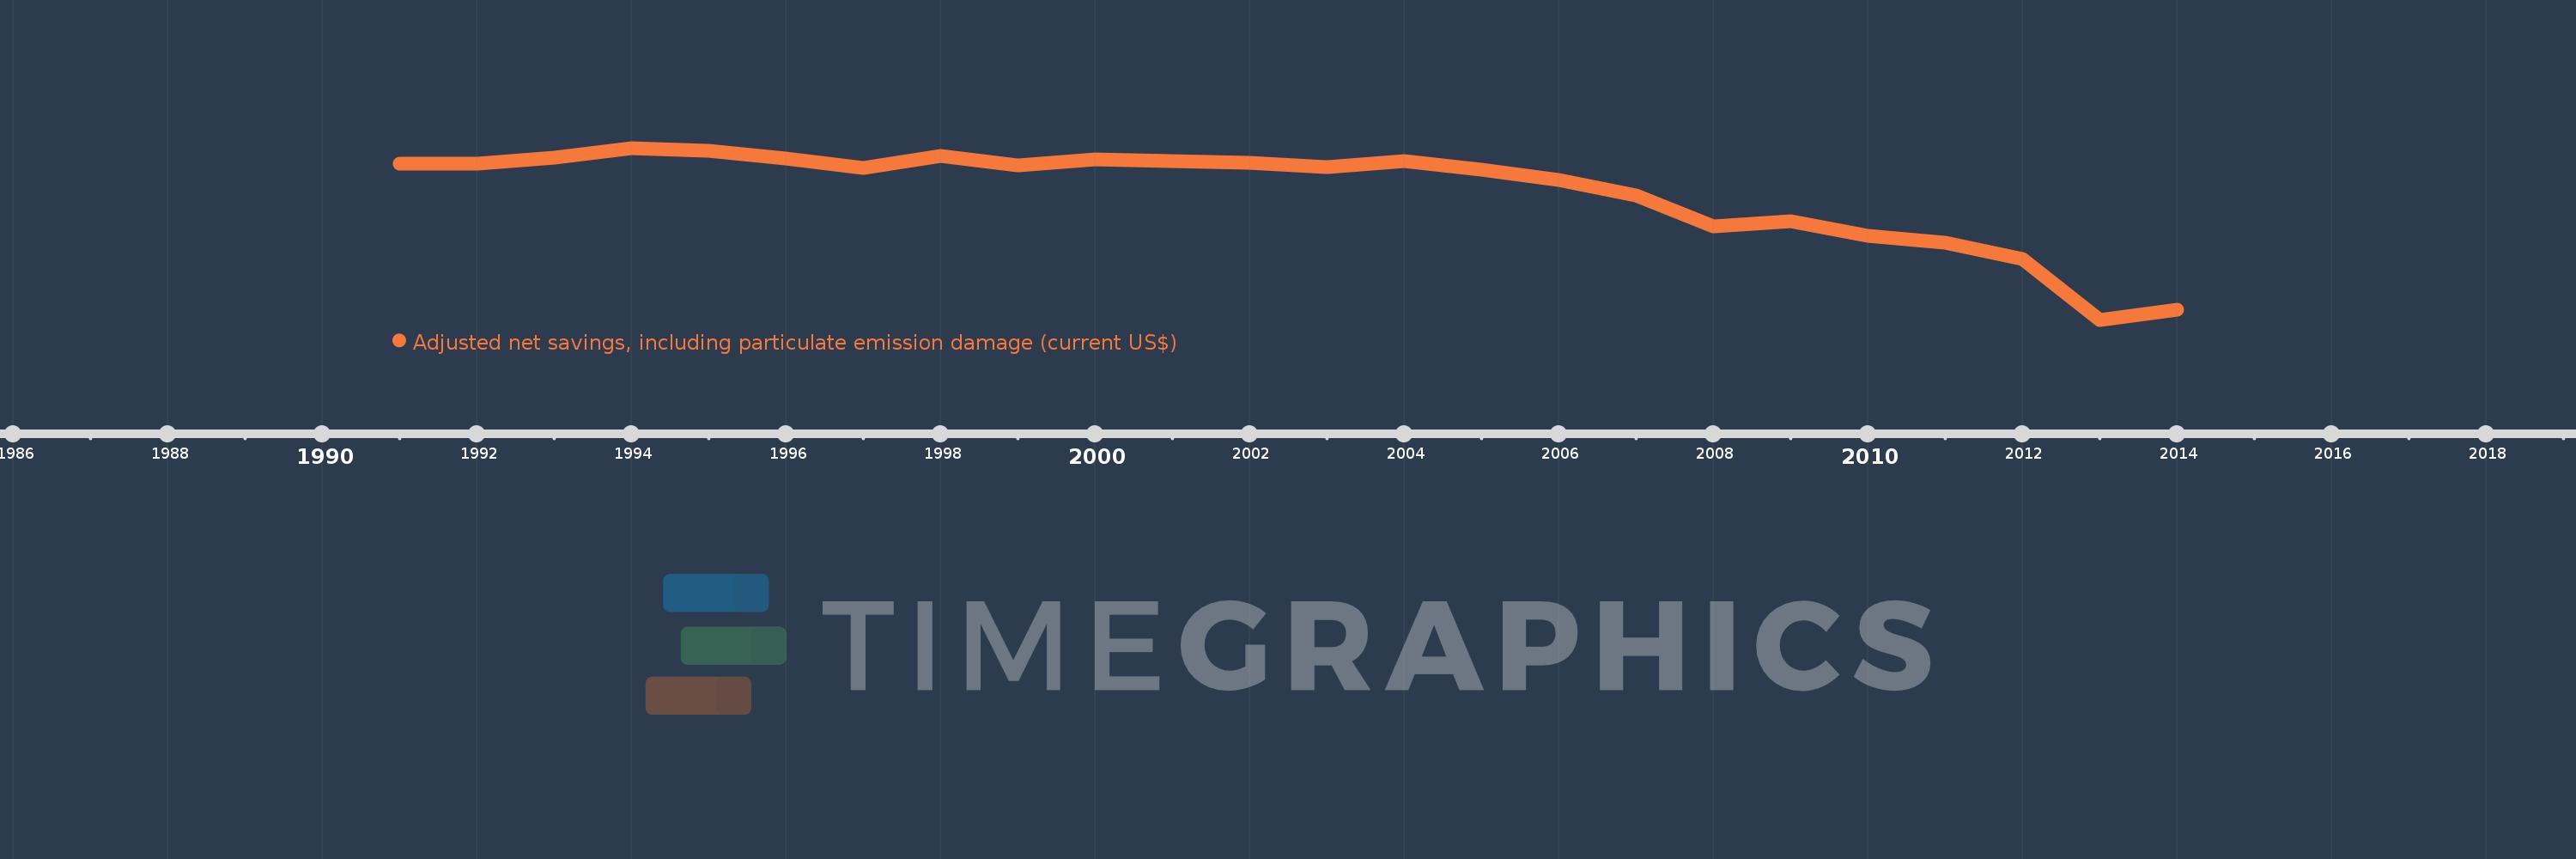
Adjusted net savings, including particulate emission damage (current US$)
2014,2013,2012,2011,2010,2009,2008,2007,2006,2005,2004,2003,2002,2001,2000,1999,1998,1997,1996,1995,1994,1993,1992,1991
This statistics in other country:
AfghanistanAlbaniaAlgeriaAngolaArgentinaArmeniaAustraliaAustriaAzerbaijanBahamas, TheBahrainBangladeshBarbadosBelarusBelgiumBelizeBeninBhutanBoliviaBotswanaBrazilBrunei DarussalamBulgariaBurkina FasoBurundiCabo VerdeCambodiaCameroonCanadaCentral African RepublicChadChileChinaColombiaComorosCongo, Dem. Rep.Congo, Rep.Costa RicaCote d'IvoireCroatiaCyprusCzech RepublicDenmarkDominican RepublicEcuadorEgypt, Arab Rep.El SalvadorEquatorial GuineaEritreaEstoniaEthiopiaFijiFinlandFranceGabonGambia, TheGeorgiaGermanyGhanaGreeceGuatemalaGuineaGuinea-BissauGuyanaHaitiHondurasHungaryIcelandIndiaIndonesiaIran, Islamic Rep.IraqIrelandIsraelItalyJamaicaJapanJordanKazakhstanKenyaKorea, Rep.KuwaitKyrgyz RepublicLao PDRLatviaLebanonLesothoLiberiaLibyaLithuaniaLuxembourgMacedonia, FYRMadagascarMalawiMalaysiaMaldivesMaliMauritaniaMauritiusMexicoMoldovaMongoliaMoroccoMozambiqueNamibiaNepalNetherlandsNew ZealandNicaraguaNigerNigeriaNorwayOmanPakistanPanamaPapua New GuineaParaguayPeruPhilippinesPolandPortugalQatarRomaniaRussian FederationRwandaSaudi ArabiaSenegalSierra LeoneSingaporeSlovak RepublicSloveniaSolomon IslandsSouth AfricaSpainSri LankaSudanSurinameSwazilandSwedenSwitzerlandSyrian Arab RepublicTajikistanTanzaniaThailandTogoTrinidad and TobagoTunisiaTurkeyUgandaUkraineUnited KingdomUnited StatesUruguayVenezuela, RBVietnamYemen, Rep.ZambiaZimbabwe Timeline:
This timeline shows a graph from 1991 to 2014 of Guinea. No data until 1990. Number of actual observations by date: 24.
Source name:
World Development Indicators
Source organization:
World Bank staff estimates based on sources and methods in World Bank's "The Changing Wealth of Nations: Measuring Sustainable Development in the New Millennium" (2011).
Categories, topics:
Economy & Growth, Environment
Last updated:
apr 23, 2017
Indicators value changes by year
Minimum:
-2.947 bln
jan 1, 2013
Maximum:
249.912 mln
jan 1, 1994
At the date of observation
Value
Absolute change
Change from previous value
jan 1, 1991
-43.943 mln
-43.943 mln
0.0%
jan 1, 1992
-38.205 mln
+5.737 mln
-13.06%
jan 1, 1993
65.405 mln
+103.611 mln
-271.19%
jan 1, 1994
249.912 mln
+184.507 mln
282.1%
jan 1, 1995
194.492 mln
-55.421 mln
-22.18%
jan 1, 1996
51.423 mln
-143.068 mln
-73.56%
jan 1, 1997
-115.561 mln
-166.984 mln
-324.72%
jan 1, 1998
94.622 mln
+210.183 mln
-181.88%
jan 1, 1999
-66.896 mln
-161.519 mln
-170.7%
jan 1, 2000
33.625 mln
+100.521 mln
-150.26%
jan 1, 2001
13.32 mln
-20.306 mln
-60.39%
jan 1, 2002
-19.128 mln
-32.448 mln
-243.61%
jan 1, 2003
-106.324 mln
-87.196 mln
455.85%
jan 1, 2004
5.205 mln
+111.529 mln
-104.9%
jan 1, 2005
-150.789 mln
-155.993 mln
-3.0K%
jan 1, 2006
-340.118 mln
-189.329 mln
125.56%
jan 1, 2007
-628.881 mln
-288.763 mln
84.9%
jan 1, 2008
-1.203 bln
-574.552 mln
91.36%
jan 1, 2009
-1.119 bln
+84.491 mln
-7.02%
jan 1, 2010
-1.378 bln
-259.111 mln
23.16%
jan 1, 2011
-1.506 bln
-128.231 mln
9.31%
jan 1, 2012
-1.817 bln
-310.242 mln
20.6%
jan 1, 2013
-2.947 bln
-1.13 bln
62.23%
jan 1, 2014
-2.76 bln
+187.483 mln
-6.36%
Ranking of countries by current statistics by years


Comments: