29
/
en
AIzaSyAYiBZKx7MnpbEhh9jyipgxe19OcubqV5w
April 1, 2024
133799
France
FRA
true
2
1
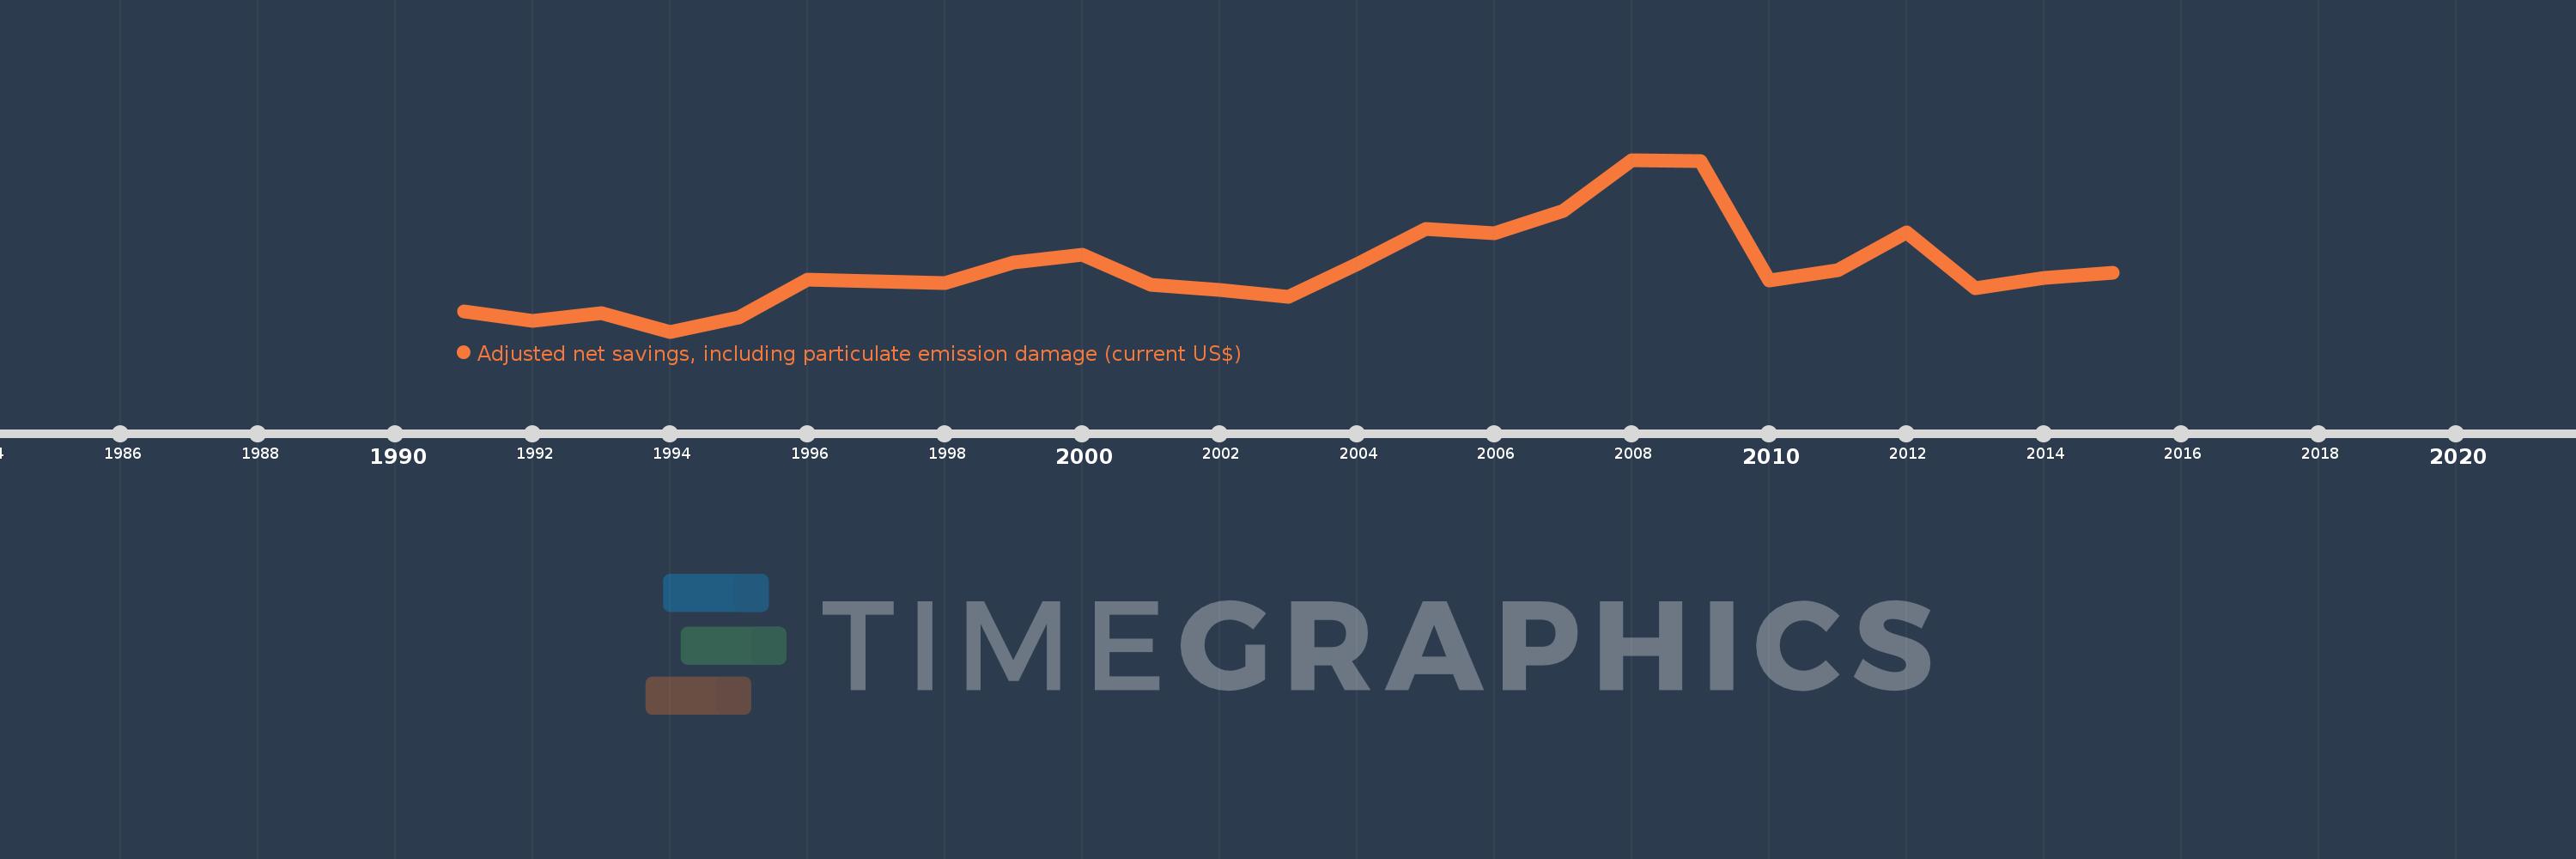
Adjusted net savings, including particulate emission damage (current US$)
2015,2014,2013,2012,2011,2010,2009,2008,2007,2006,2005,2004,2003,2002,2001,2000,1999,1998,1997,1996,1995,1994,1993,1992,1991
This statistics in other country:
AfghanistanAlbaniaAlgeriaAngolaArgentinaArmeniaAustraliaAustriaAzerbaijanBahamas, TheBahrainBangladeshBarbadosBelarusBelgiumBelizeBeninBhutanBoliviaBotswanaBrazilBrunei DarussalamBulgariaBurkina FasoBurundiCabo VerdeCambodiaCameroonCanadaCentral African RepublicChadChileChinaColombiaComorosCongo, Dem. Rep.Congo, Rep.Costa RicaCote d'IvoireCroatiaCyprusCzech RepublicDenmarkDominican RepublicEcuadorEgypt, Arab Rep.El SalvadorEquatorial GuineaEritreaEstoniaEthiopiaFijiFinlandFranceGabonGambia, TheGeorgiaGermanyGhanaGreeceGuatemalaGuineaGuinea-BissauGuyanaHaitiHondurasHungaryIcelandIndiaIndonesiaIran, Islamic Rep.IraqIrelandIsraelItalyJamaicaJapanJordanKazakhstanKenyaKorea, Rep.KuwaitKyrgyz RepublicLao PDRLatviaLebanonLesothoLiberiaLibyaLithuaniaLuxembourgMacedonia, FYRMadagascarMalawiMalaysiaMaldivesMaliMauritaniaMauritiusMexicoMoldovaMongoliaMoroccoMozambiqueNamibiaNepalNetherlandsNew ZealandNicaraguaNigerNigeriaNorwayOmanPakistanPanamaPapua New GuineaParaguayPeruPhilippinesPolandPortugalQatarRomaniaRussian FederationRwandaSaudi ArabiaSenegalSierra LeoneSingaporeSlovak RepublicSloveniaSolomon IslandsSouth AfricaSpainSri LankaSudanSurinameSwazilandSwedenSwitzerlandSyrian Arab RepublicTajikistanTanzaniaThailandTogoTrinidad and TobagoTunisiaTurkeyUgandaUkraineUnited KingdomUnited StatesUruguayVenezuela, RBVietnamYemen, Rep.ZambiaZimbabwe Timeline:
This timeline shows a graph from 1991 to 2015 of France. No data until 1990. Number of actual observations by date: 25.
Source name:
World Development Indicators
Source organization:
World Bank staff estimates based on sources and methods in World Bank's "The Changing Wealth of Nations: Measuring Sustainable Development in the New Millennium" (2011).
Categories, topics:
Economy & Growth, Environment
Last updated:
apr 23, 2017
Indicators value changes by year
Minimum:
134.471 bln
jan 1, 1994
Maximum:
301.701 bln
jan 1, 2008
At the date of observation
Value
Absolute change
Change from previous value
jan 1, 1991
153.795 bln
+153.795 bln
0.0%
jan 1, 1992
144.833 bln
-8.962 bln
-5.83%
jan 1, 1993
152.134 bln
+7.301 bln
5.04%
jan 1, 1994
134.471 bln
-17.662 bln
-11.61%
jan 1, 1995
148.03 bln
+13.558 bln
10.08%
jan 1, 1996
184.777 bln
+36.748 bln
24.82%
jan 1, 1997
183.455 bln
-1.323 bln
-0.72%
jan 1, 1998
181.62 bln
-1.835 bln
-1.0%
jan 1, 1999
201.795 bln
+20.175 bln
11.11%
jan 1, 2000
209.064 bln
+7.269 bln
3.6%
jan 1, 2001
179.74 bln
-29.324 bln
-14.03%
jan 1, 2002
174.814 bln
-4.926 bln
-2.74%
jan 1, 2003
168.542 bln
-6.271 bln
-3.59%
jan 1, 2004
200.083 bln
+31.54 bln
18.71%
jan 1, 2005
234.284 bln
+34.202 bln
17.09%
jan 1, 2006
230.157 bln
-4.128 bln
-1.76%
jan 1, 2007
252.018 bln
+21.861 bln
9.5%
jan 1, 2008
301.701 bln
+49.683 bln
19.71%
jan 1, 2009
300.716 bln
-984.625 mln
-0.33%
jan 1, 2010
184.501 bln
-116.215 bln
-38.65%
jan 1, 2011
194.628 bln
+10.127 bln
5.49%
jan 1, 2012
230.877 bln
+36.249 bln
18.62%
jan 1, 2013
176.349 bln
-54.528 bln
-23.62%
jan 1, 2014
187.08 bln
+10.731 bln
6.09%
jan 1, 2015
191.346 bln
+4.266 bln
2.28%
Ranking of countries by current statistics by years


Comments: