29
/
en
AIzaSyAYiBZKx7MnpbEhh9jyipgxe19OcubqV5w
April 1, 2024
207631
Netherlands
NLD
true
2
1
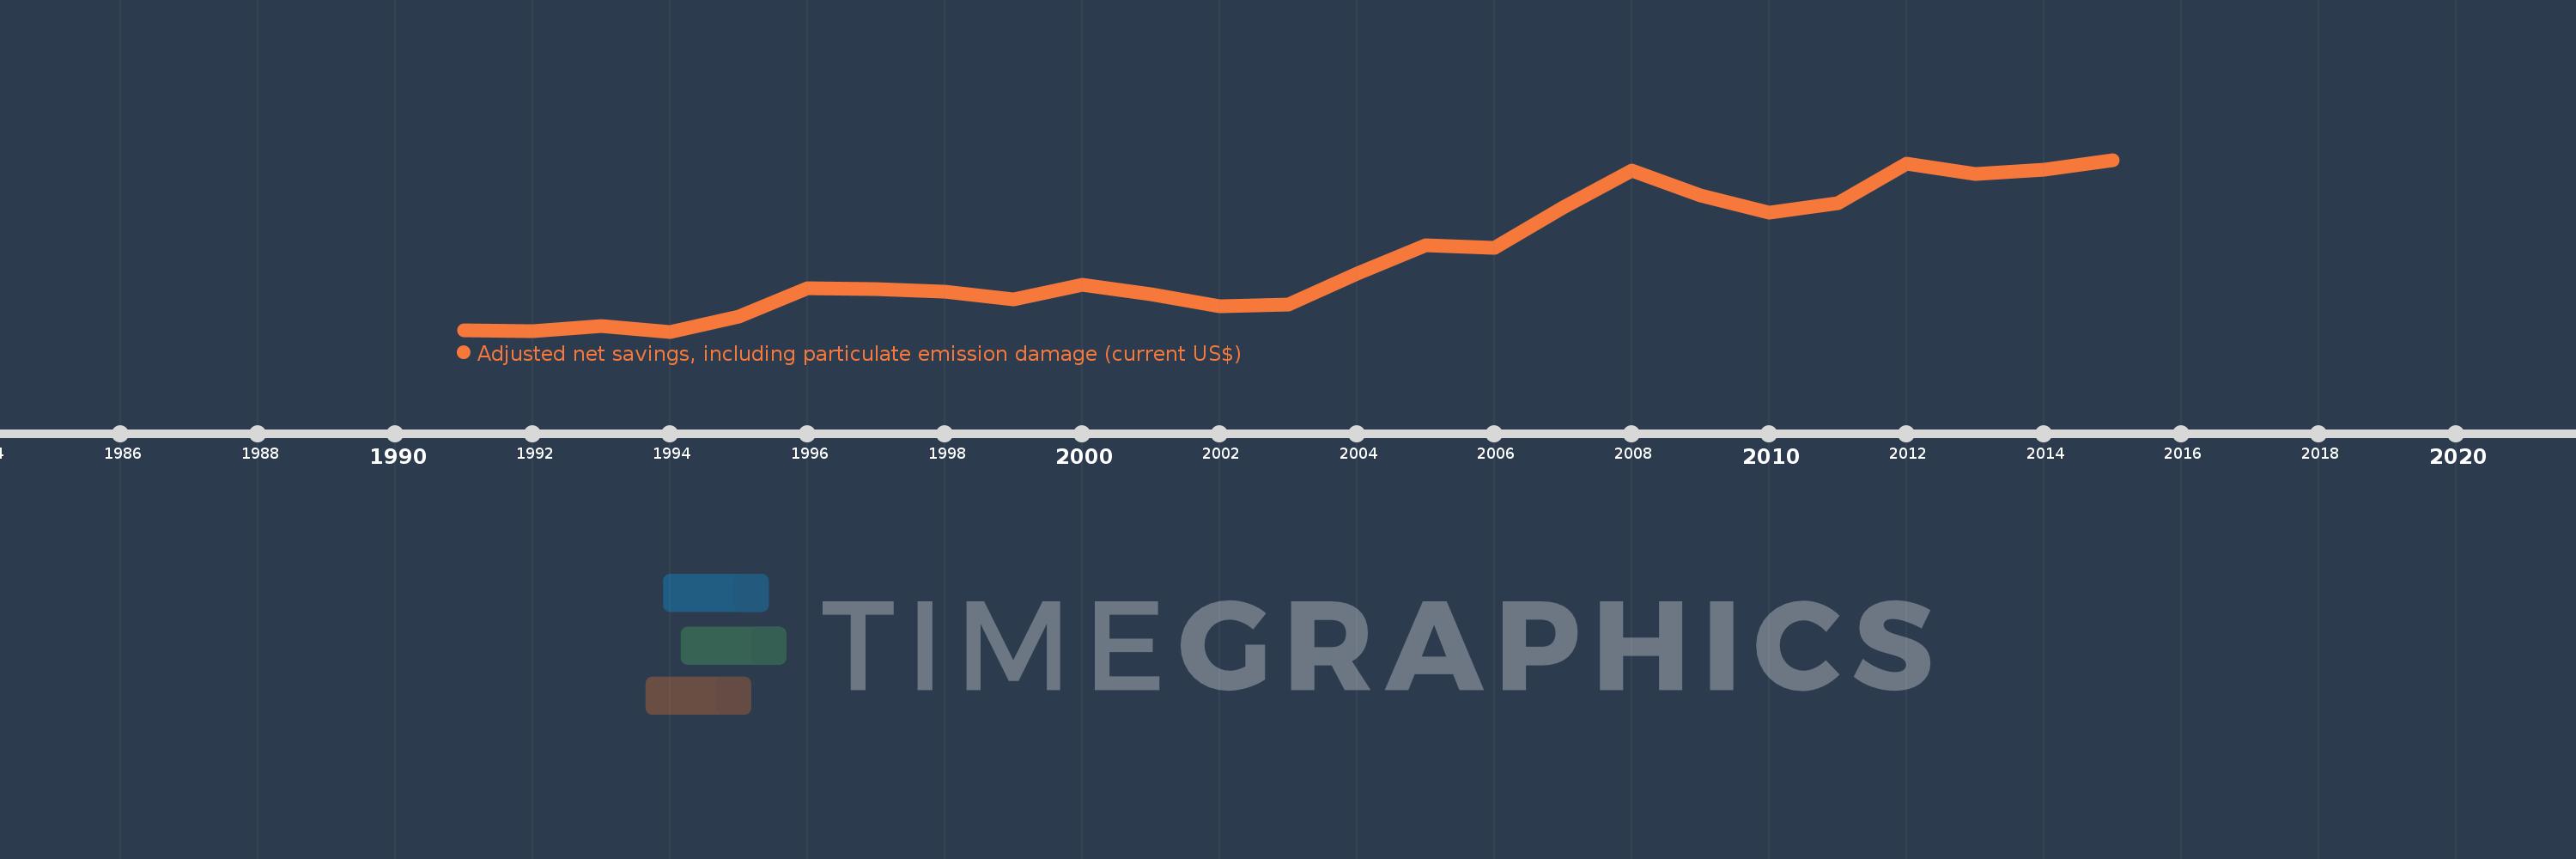
Adjusted net savings, including particulate emission damage (current US$)
2015,2014,2013,2012,2011,2010,2009,2008,2007,2006,2005,2004,2003,2002,2001,2000,1999,1998,1997,1996,1995,1994,1993,1992,1991
This statistics in other country:
AfghanistanAlbaniaAlgeriaAngolaArgentinaArmeniaAustraliaAustriaAzerbaijanBahamas, TheBahrainBangladeshBarbadosBelarusBelgiumBelizeBeninBhutanBoliviaBotswanaBrazilBrunei DarussalamBulgariaBurkina FasoBurundiCabo VerdeCambodiaCameroonCanadaCentral African RepublicChadChileChinaColombiaComorosCongo, Dem. Rep.Congo, Rep.Costa RicaCote d'IvoireCroatiaCyprusCzech RepublicDenmarkDominican RepublicEcuadorEgypt, Arab Rep.El SalvadorEquatorial GuineaEritreaEstoniaEthiopiaFijiFinlandFranceGabonGambia, TheGeorgiaGermanyGhanaGreeceGuatemalaGuineaGuinea-BissauGuyanaHaitiHondurasHungaryIcelandIndiaIndonesiaIran, Islamic Rep.IraqIrelandIsraelItalyJamaicaJapanJordanKazakhstanKenyaKorea, Rep.KuwaitKyrgyz RepublicLao PDRLatviaLebanonLesothoLiberiaLibyaLithuaniaLuxembourgMacedonia, FYRMadagascarMalawiMalaysiaMaldivesMaliMauritaniaMauritiusMexicoMoldovaMongoliaMoroccoMozambiqueNamibiaNepalNetherlandsNew ZealandNicaraguaNigerNigeriaNorwayOmanPakistanPanamaPapua New GuineaParaguayPeruPhilippinesPolandPortugalQatarRomaniaRussian FederationRwandaSaudi ArabiaSenegalSierra LeoneSingaporeSlovak RepublicSloveniaSolomon IslandsSouth AfricaSpainSri LankaSudanSurinameSwazilandSwedenSwitzerlandSyrian Arab RepublicTajikistanTanzaniaThailandTogoTrinidad and TobagoTunisiaTurkeyUgandaUkraineUnited KingdomUnited StatesUruguayVenezuela, RBVietnamYemen, Rep.ZambiaZimbabwe Timeline:
This timeline shows a graph from 1991 to 2015 of Netherlands. No data until 1990. Number of actual observations by date: 25.
Source name:
World Development Indicators
Source organization:
World Bank staff estimates based on sources and methods in World Bank's "The Changing Wealth of Nations: Measuring Sustainable Development in the New Millennium" (2011).
Categories, topics:
Economy & Growth, Environment
Last updated:
apr 23, 2017
Indicators value changes by year
Minimum:
46.341 bln
jan 1, 1994
Maximum:
150.765 bln
jan 1, 2015
At the date of observation
Value
Absolute change
Change from previous value
jan 1, 1991
47.117 bln
+47.117 bln
0.0%
jan 1, 1992
46.452 bln
-665.818 mln
-1.41%
jan 1, 1993
49.937 bln
+3.485 bln
7.5%
jan 1, 1994
46.341 bln
-3.596 bln
-7.2%
jan 1, 1995
55.52 bln
+9.179 bln
19.81%
jan 1, 1996
72.637 bln
+17.117 bln
30.83%
jan 1, 1997
72.114 bln
-522.297 mln
-0.72%
jan 1, 1998
70.815 bln
-1.3 bln
-1.8%
jan 1, 1999
66.129 bln
-4.685 bln
-6.62%
jan 1, 2000
74.596 bln
+8.467 bln
12.8%
jan 1, 2001
69.314 bln
-5.282 bln
-7.08%
jan 1, 2002
61.621 bln
-7.693 bln
-11.1%
jan 1, 2003
62.86 bln
+1.239 bln
2.01%
jan 1, 2004
81.407 bln
+18.547 bln
29.5%
jan 1, 2005
98.909 bln
+17.502 bln
21.5%
jan 1, 2006
97.167 bln
-1.742 bln
-1.76%
jan 1, 2007
121.612 bln
+24.445 bln
25.16%
jan 1, 2008
144.427 bln
+22.816 bln
18.76%
jan 1, 2009
129.227 bln
-15.201 bln
-10.52%
jan 1, 2010
118.439 bln
-10.788 bln
-8.35%
jan 1, 2011
124.286 bln
+5.847 bln
4.94%
jan 1, 2012
148.365 bln
+24.08 bln
19.37%
jan 1, 2013
142.294 bln
-6.072 bln
-4.09%
jan 1, 2014
144.946 bln
+2.652 bln
1.86%
jan 1, 2015
150.765 bln
+5.82 bln
4.02%
Ranking of countries by current statistics by years


Comments: