29
/
en
AIzaSyAYiBZKx7MnpbEhh9jyipgxe19OcubqV5w
April 1, 2024
215975
Pakistan
PAK
true
2
1
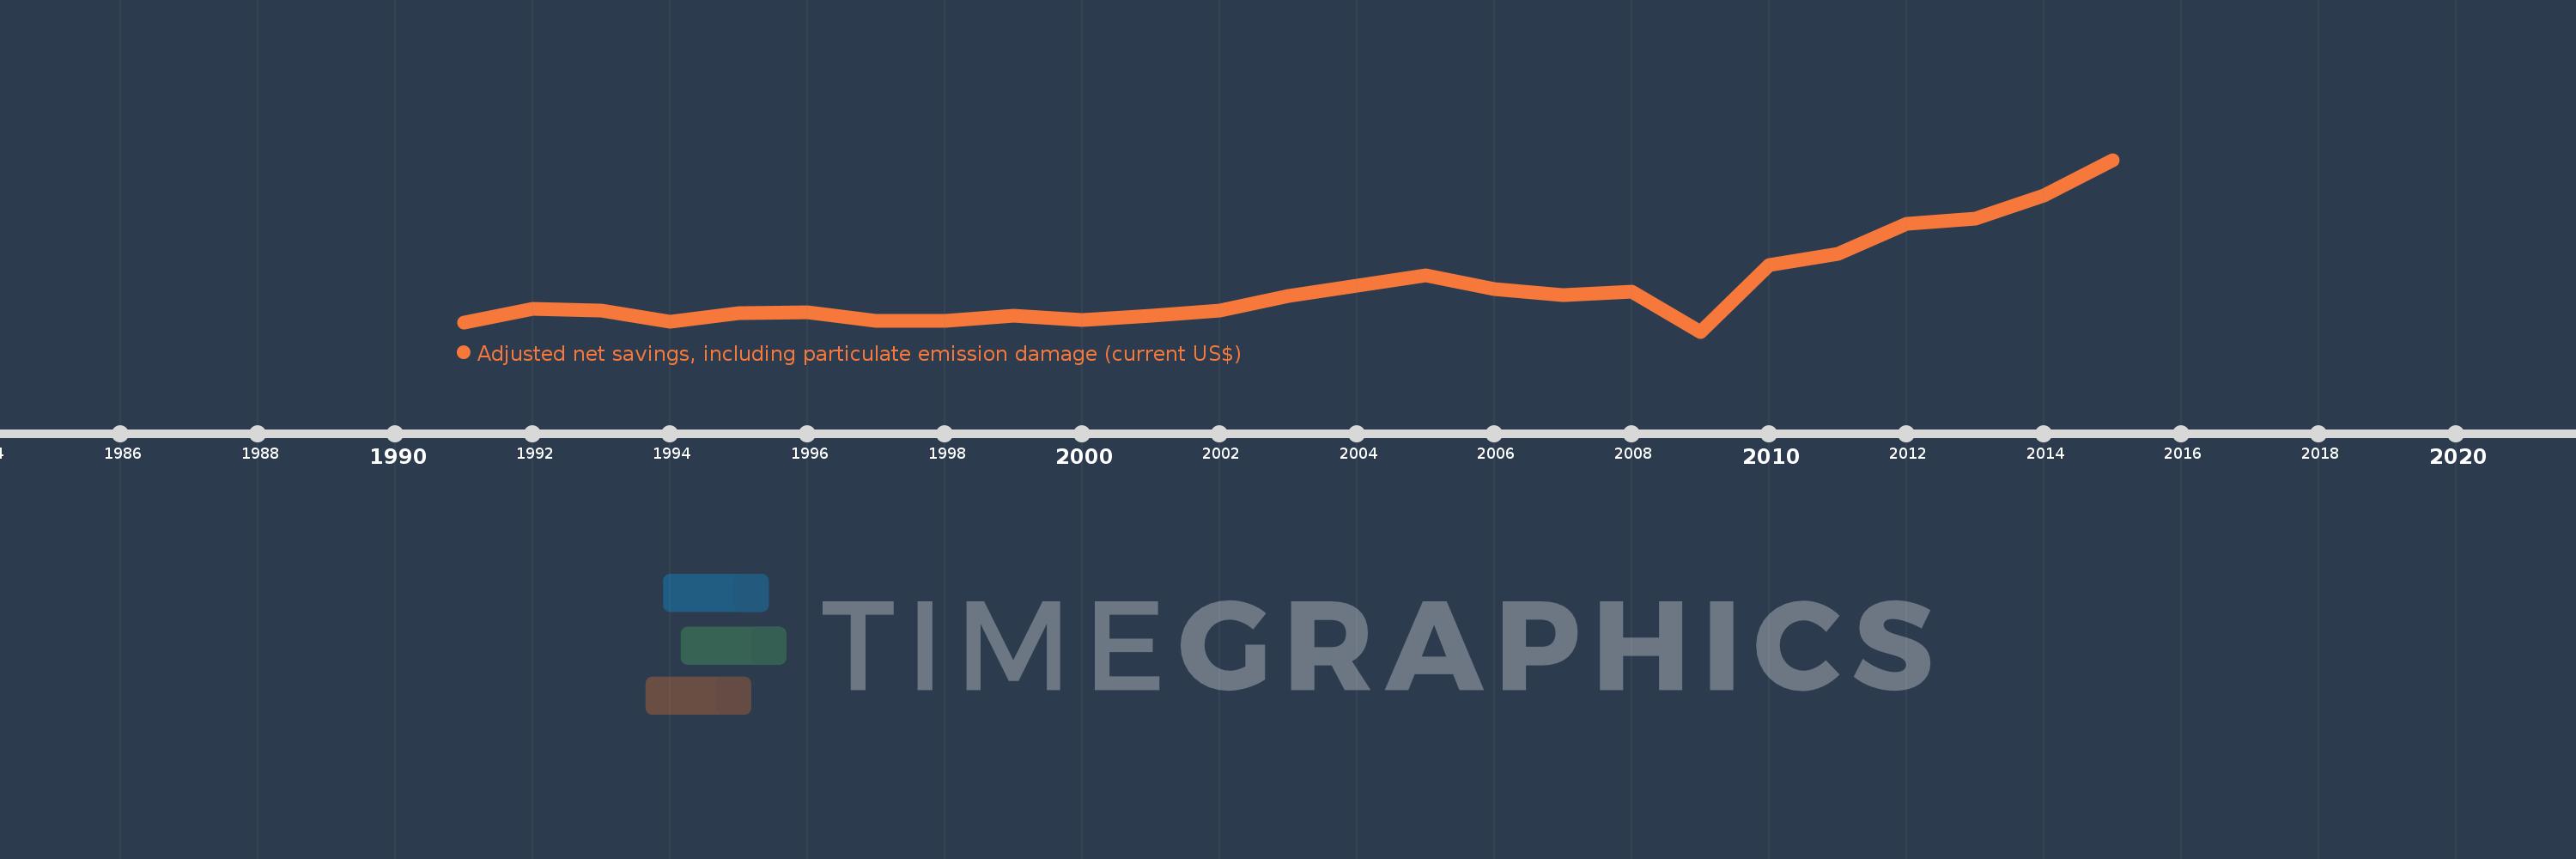
Adjusted net savings, including particulate emission damage (current US$)
2015,2014,2013,2012,2011,2010,2009,2008,2007,2006,2005,2004,2003,2002,2001,2000,1999,1998,1997,1996,1995,1994,1993,1992,1991
This statistics in other country:
AfghanistanAlbaniaAlgeriaAngolaArgentinaArmeniaAustraliaAustriaAzerbaijanBahamas, TheBahrainBangladeshBarbadosBelarusBelgiumBelizeBeninBhutanBoliviaBotswanaBrazilBrunei DarussalamBulgariaBurkina FasoBurundiCabo VerdeCambodiaCameroonCanadaCentral African RepublicChadChileChinaColombiaComorosCongo, Dem. Rep.Congo, Rep.Costa RicaCote d'IvoireCroatiaCyprusCzech RepublicDenmarkDominican RepublicEcuadorEgypt, Arab Rep.El SalvadorEquatorial GuineaEritreaEstoniaEthiopiaFijiFinlandFranceGabonGambia, TheGeorgiaGermanyGhanaGreeceGuatemalaGuineaGuinea-BissauGuyanaHaitiHondurasHungaryIcelandIndiaIndonesiaIran, Islamic Rep.IraqIrelandIsraelItalyJamaicaJapanJordanKazakhstanKenyaKorea, Rep.KuwaitKyrgyz RepublicLao PDRLatviaLebanonLesothoLiberiaLibyaLithuaniaLuxembourgMacedonia, FYRMadagascarMalawiMalaysiaMaldivesMaliMauritaniaMauritiusMexicoMoldovaMongoliaMoroccoMozambiqueNamibiaNepalNetherlandsNew ZealandNicaraguaNigerNigeriaNorwayOmanPakistanPanamaPapua New GuineaParaguayPeruPhilippinesPolandPortugalQatarRomaniaRussian FederationRwandaSaudi ArabiaSenegalSierra LeoneSingaporeSlovak RepublicSloveniaSolomon IslandsSouth AfricaSpainSri LankaSudanSurinameSwazilandSwedenSwitzerlandSyrian Arab RepublicTajikistanTanzaniaThailandTogoTrinidad and TobagoTunisiaTurkeyUgandaUkraineUnited KingdomUnited StatesUruguayVenezuela, RBVietnamYemen, Rep.ZambiaZimbabwe Timeline:
This timeline shows a graph from 1991 to 2015 of Pakistan. No data until 1990. Number of actual observations by date: 25.
Source name:
World Development Indicators
Source organization:
World Bank staff estimates based on sources and methods in World Bank's "The Changing Wealth of Nations: Measuring Sustainable Development in the New Millennium" (2011).
Categories, topics:
Economy & Growth, Environment
Last updated:
apr 23, 2017
Indicators value changes by year
Minimum:
2.442 bln
jan 1, 2009
Maximum:
36.326 bln
jan 1, 2015
At the date of observation
Value
Absolute change
Change from previous value
jan 1, 1991
4.28 bln
+4.28 bln
0.0%
jan 1, 1992
6.849 bln
+2.569 bln
60.03%
jan 1, 1993
6.607 bln
-241.872 mln
-3.53%
jan 1, 1994
4.348 bln
-2.259 bln
-34.19%
jan 1, 1995
6.042 bln
+1.694 bln
38.97%
jan 1, 1996
6.215 bln
+172.713 mln
2.86%
jan 1, 1997
4.501 bln
-1.714 bln
-27.58%
jan 1, 1998
4.644 bln
+142.967 mln
3.18%
jan 1, 1999
5.555 bln
+911.856 mln
19.64%
jan 1, 2000
4.756 bln
-799.868 mln
-14.4%
jan 1, 2001
5.594 bln
+838.474 mln
17.63%
jan 1, 2002
6.671 bln
+1.077 bln
19.25%
jan 1, 2003
9.532 bln
+2.861 bln
42.89%
jan 1, 2004
11.579 bln
+2.047 bln
21.47%
jan 1, 2005
13.473 bln
+1.894 bln
16.35%
jan 1, 2006
10.825 bln
-2.648 bln
-19.66%
jan 1, 2007
9.61 bln
-1.215 bln
-11.22%
jan 1, 2008
10.26 bln
+649.575 mln
6.76%
jan 1, 2009
2.442 bln
-7.818 bln
-76.2%
jan 1, 2010
15.65 bln
+13.208 bln
540.98%
jan 1, 2011
17.844 bln
+2.195 bln
14.02%
jan 1, 2012
23.689 bln
+5.845 bln
32.76%
jan 1, 2013
24.761 bln
+1.071 bln
4.52%
jan 1, 2014
29.276 bln
+4.516 bln
18.24%
jan 1, 2015
36.326 bln
+7.05 bln
24.08%
Ranking of countries by current statistics by years


Comments: