29
/
en
AIzaSyAYiBZKx7MnpbEhh9jyipgxe19OcubqV5w
April 1, 2024
256010
Sweden
SWE
true
2
1
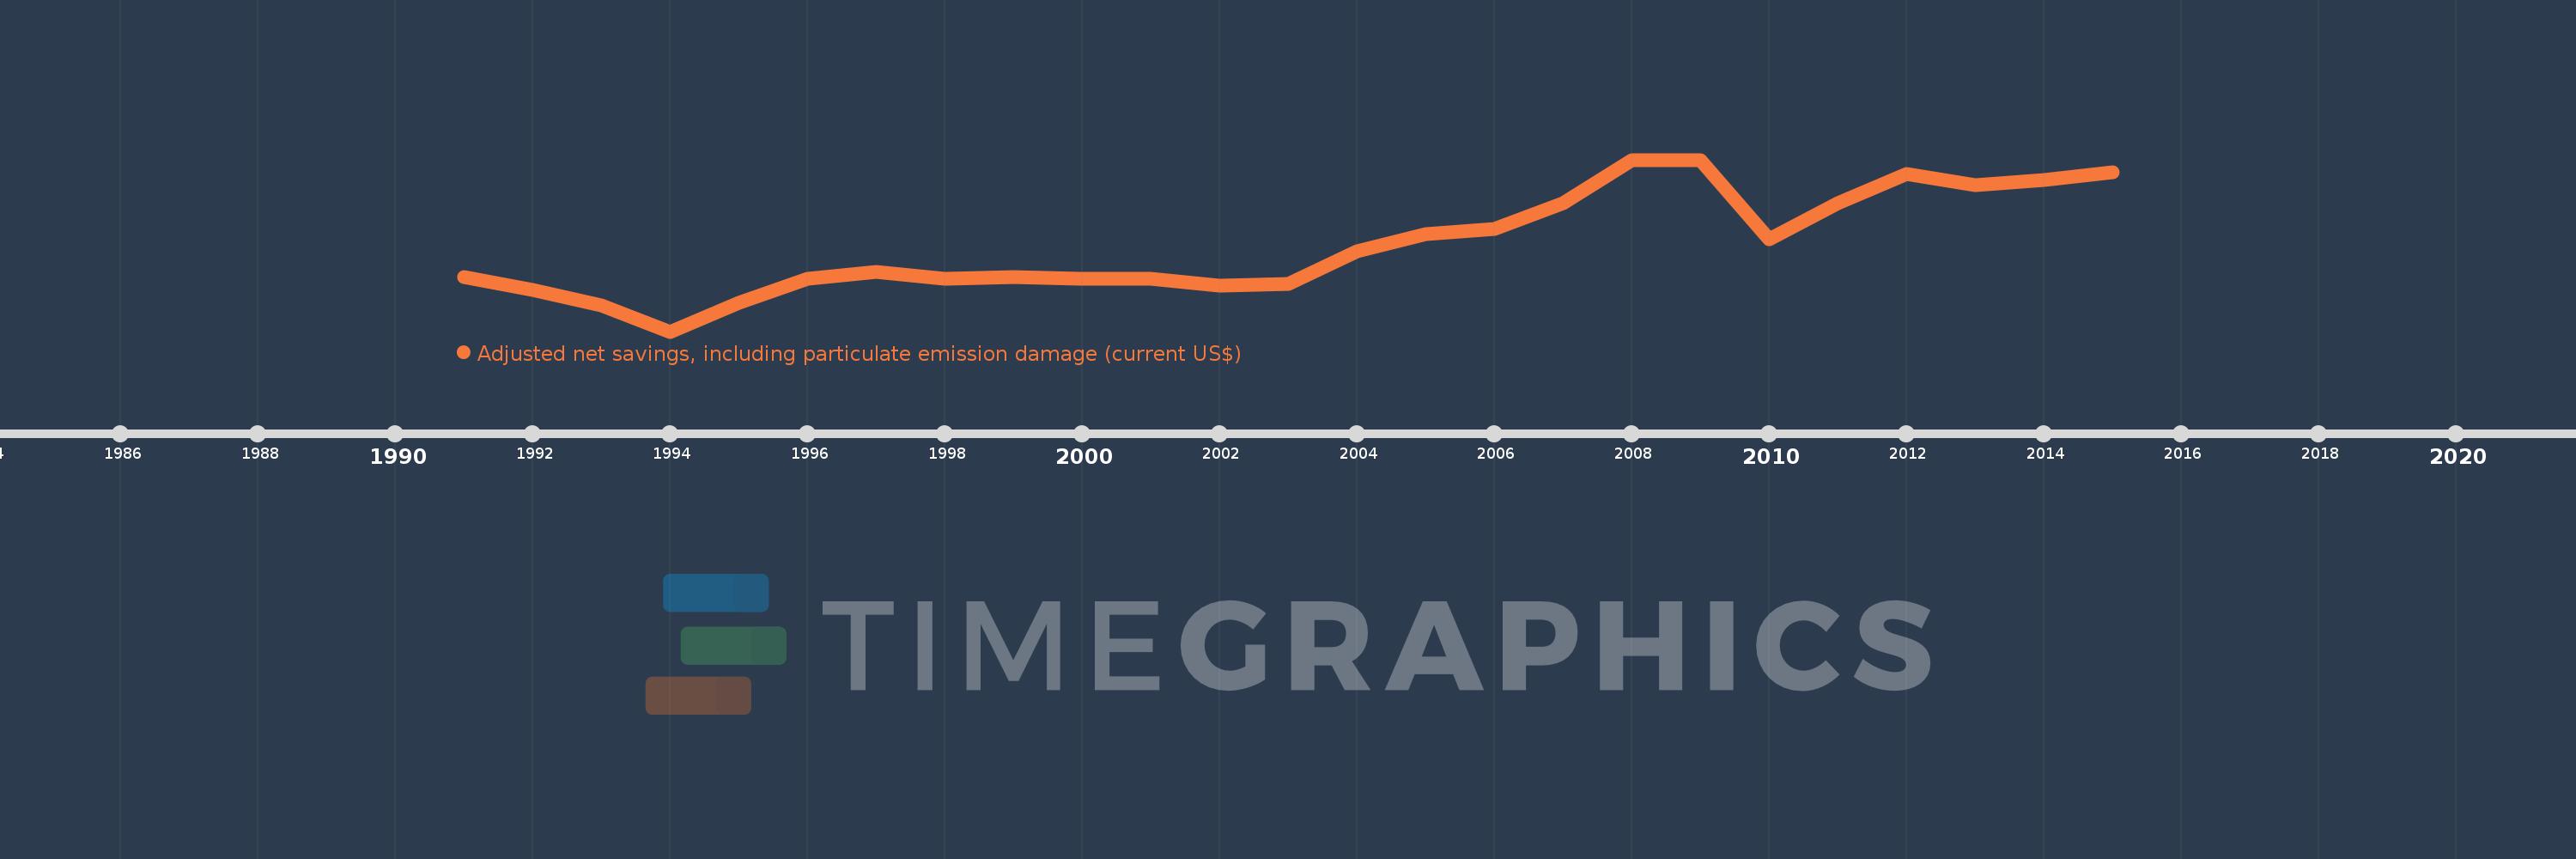
Adjusted net savings, including particulate emission damage (current US$)
2015,2014,2013,2012,2011,2010,2009,2008,2007,2006,2005,2004,2003,2002,2001,2000,1999,1998,1997,1996,1995,1994,1993,1992,1991
This statistics in other country:
AfghanistanAlbaniaAlgeriaAngolaArgentinaArmeniaAustraliaAustriaAzerbaijanBahamas, TheBahrainBangladeshBarbadosBelarusBelgiumBelizeBeninBhutanBoliviaBotswanaBrazilBrunei DarussalamBulgariaBurkina FasoBurundiCabo VerdeCambodiaCameroonCanadaCentral African RepublicChadChileChinaColombiaComorosCongo, Dem. Rep.Congo, Rep.Costa RicaCote d'IvoireCroatiaCyprusCzech RepublicDenmarkDominican RepublicEcuadorEgypt, Arab Rep.El SalvadorEquatorial GuineaEritreaEstoniaEthiopiaFijiFinlandFranceGabonGambia, TheGeorgiaGermanyGhanaGreeceGuatemalaGuineaGuinea-BissauGuyanaHaitiHondurasHungaryIcelandIndiaIndonesiaIran, Islamic Rep.IraqIrelandIsraelItalyJamaicaJapanJordanKazakhstanKenyaKorea, Rep.KuwaitKyrgyz RepublicLao PDRLatviaLebanonLesothoLiberiaLibyaLithuaniaLuxembourgMacedonia, FYRMadagascarMalawiMalaysiaMaldivesMaliMauritaniaMauritiusMexicoMoldovaMongoliaMoroccoMozambiqueNamibiaNepalNetherlandsNew ZealandNicaraguaNigerNigeriaNorwayOmanPakistanPanamaPapua New GuineaParaguayPeruPhilippinesPolandPortugalQatarRomaniaRussian FederationRwandaSaudi ArabiaSenegalSierra LeoneSingaporeSlovak RepublicSloveniaSolomon IslandsSouth AfricaSpainSri LankaSudanSurinameSwazilandSwedenSwitzerlandSyrian Arab RepublicTajikistanTanzaniaThailandTogoTrinidad and TobagoTunisiaTurkeyUgandaUkraineUnited KingdomUnited StatesUruguayVenezuela, RBVietnamYemen, Rep.ZambiaZimbabwe Timeline:
This timeline shows a graph from 1991 to 2015 of Sweden. No data until 1990. Number of actual observations by date: 25.
Source name:
World Development Indicators
Source organization:
World Bank staff estimates based on sources and methods in World Bank's "The Changing Wealth of Nations: Measuring Sustainable Development in the New Millennium" (2011).
Categories, topics:
Economy & Growth, Environment
Last updated:
apr 23, 2017
Indicators value changes by year
Minimum:
17.136 bln
jan 1, 1994
Maximum:
118.606 bln
jan 1, 2009
At the date of observation
Value
Absolute change
Change from previous value
jan 1, 1991
49.477 bln
+49.477 bln
0.0%
jan 1, 1992
41.845 bln
-7.632 bln
-15.43%
jan 1, 1993
32.544 bln
-9.301 bln
-22.23%
jan 1, 1994
17.136 bln
-15.408 bln
-47.35%
jan 1, 1995
33.932 bln
+16.796 bln
98.02%
jan 1, 1996
48.568 bln
+14.637 bln
43.14%
jan 1, 1997
52.331 bln
+3.762 bln
7.75%
jan 1, 1998
48.441 bln
-3.889 bln
-7.43%
jan 1, 1999
49.178 bln
+736.644 mln
1.52%
jan 1, 2000
48.519 bln
-659.082 mln
-1.34%
jan 1, 2001
48.338 bln
-180.916 mln
-0.37%
jan 1, 2002
44.143 bln
-4.195 bln
-8.68%
jan 1, 2003
45.171 bln
+1.027 bln
2.33%
jan 1, 2004
64.548 bln
+19.378 bln
42.9%
jan 1, 2005
74.76 bln
+10.212 bln
15.82%
jan 1, 2006
77.724 bln
+2.963 bln
3.96%
jan 1, 2007
92.955 bln
+15.231 bln
19.6%
jan 1, 2008
118.278 bln
+25.323 bln
27.24%
jan 1, 2009
118.606 bln
+328.006 mln
0.28%
jan 1, 2010
71.584 bln
-47.023 bln
-39.65%
jan 1, 2011
93.18 bln
+21.596 bln
30.17%
jan 1, 2012
110.092 bln
+16.912 bln
18.15%
jan 1, 2013
103.423 bln
-6.669 bln
-6.06%
jan 1, 2014
106.863 bln
+3.44 bln
3.33%
jan 1, 2015
111.286 bln
+4.423 bln
4.14%
Ranking of countries by current statistics by years


Comments: