29
/
en
AIzaSyAYiBZKx7MnpbEhh9jyipgxe19OcubqV5w
April 1, 2024
212556
Nigeria
NGA
true
2
1
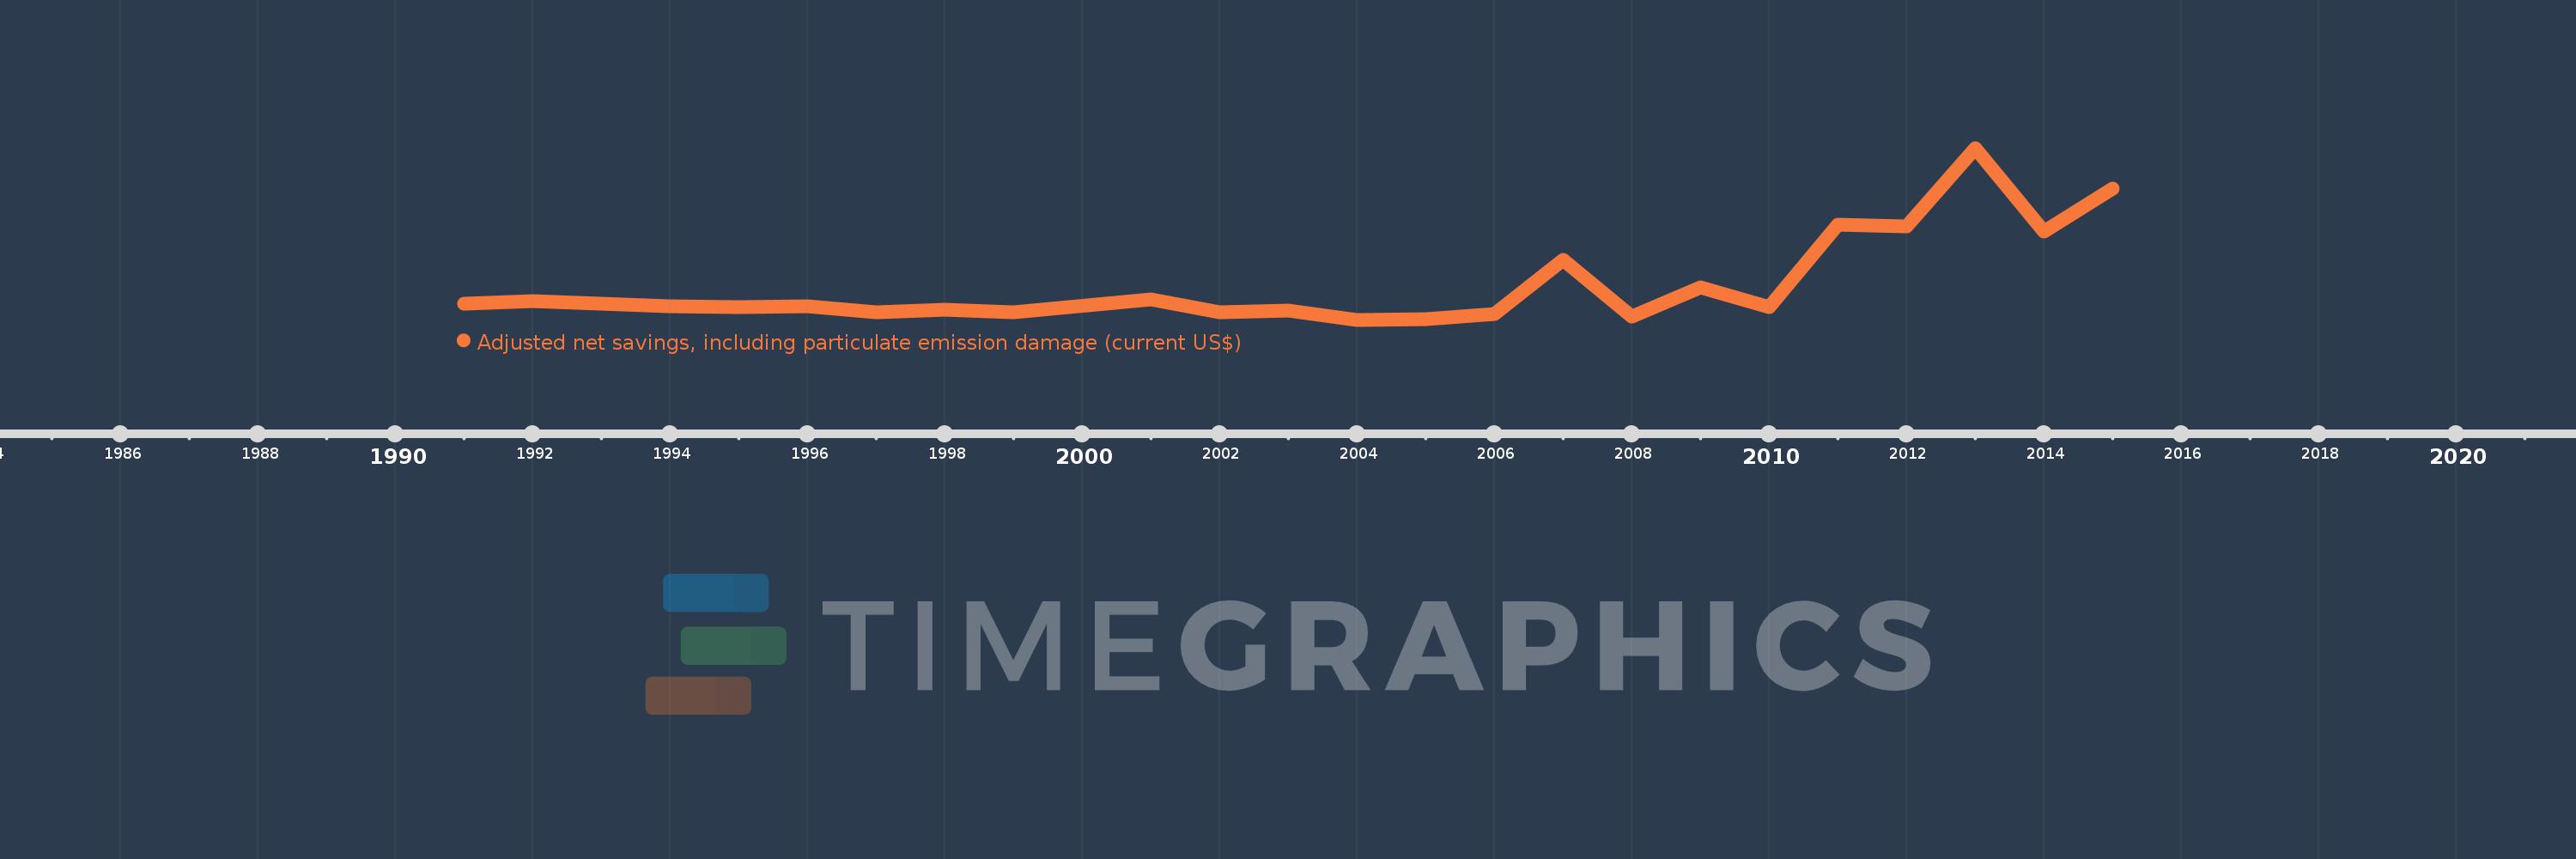
Adjusted net savings, including particulate emission damage (current US$)
2015,2014,2013,2012,2011,2010,2009,2008,2007,2006,2005,2004,2003,2002,2001,1999,1998,1997,1996,1995,1994,1993,1992,1991
This statistics in other country:
AfghanistanAlbaniaAlgeriaAngolaArgentinaArmeniaAustraliaAustriaAzerbaijanBahamas, TheBahrainBangladeshBarbadosBelarusBelgiumBelizeBeninBhutanBoliviaBotswanaBrazilBrunei DarussalamBulgariaBurkina FasoBurundiCabo VerdeCambodiaCameroonCanadaCentral African RepublicChadChileChinaColombiaComorosCongo, Dem. Rep.Congo, Rep.Costa RicaCote d'IvoireCroatiaCyprusCzech RepublicDenmarkDominican RepublicEcuadorEgypt, Arab Rep.El SalvadorEquatorial GuineaEritreaEstoniaEthiopiaFijiFinlandFranceGabonGambia, TheGeorgiaGermanyGhanaGreeceGuatemalaGuineaGuinea-BissauGuyanaHaitiHondurasHungaryIcelandIndiaIndonesiaIran, Islamic Rep.IraqIrelandIsraelItalyJamaicaJapanJordanKazakhstanKenyaKorea, Rep.KuwaitKyrgyz RepublicLao PDRLatviaLebanonLesothoLiberiaLibyaLithuaniaLuxembourgMacedonia, FYRMadagascarMalawiMalaysiaMaldivesMaliMauritaniaMauritiusMexicoMoldovaMongoliaMoroccoMozambiqueNamibiaNepalNetherlandsNew ZealandNicaraguaNigerNigeriaNorwayOmanPakistanPanamaPapua New GuineaParaguayPeruPhilippinesPolandPortugalQatarRomaniaRussian FederationRwandaSaudi ArabiaSenegalSierra LeoneSingaporeSlovak RepublicSloveniaSolomon IslandsSouth AfricaSpainSri LankaSudanSurinameSwazilandSwedenSwitzerlandSyrian Arab RepublicTajikistanTanzaniaThailandTogoTrinidad and TobagoTunisiaTurkeyUgandaUkraineUnited KingdomUnited StatesUruguayVenezuela, RBVietnamYemen, Rep.ZambiaZimbabwe Timeline:
This timeline shows a graph from 1991 to 2015 of Nigeria. No data until 1990. Number of actual observations by date: 24.
Source name:
World Development Indicators
Source organization:
World Bank staff estimates based on sources and methods in World Bank's "The Changing Wealth of Nations: Measuring Sustainable Development in the New Millennium" (2011).
Categories, topics:
Economy & Growth, Environment
Last updated:
apr 23, 2017
Indicators value changes by year
Minimum:
-14.176 bln
jan 1, 2004
Maximum:
83.332 bln
jan 1, 2013
At the date of observation
Value
Absolute change
Change from previous value
jan 1, 1991
-4.98 bln
-4.98 bln
0.0%
jan 1, 1992
-3.417 bln
+1.563 bln
-31.38%
jan 1, 1993
-5.183 bln
-1.766 bln
51.69%
jan 1, 1994
-6.525 bln
-1.341 bln
25.88%
jan 1, 1995
-7.239 bln
-714.255 mln
10.95%
jan 1, 1996
-6.64 bln
+598.684 mln
-8.27%
jan 1, 1997
-9.7 bln
-3.06 bln
46.08%
jan 1, 1998
-8.498 bln
+1.202 bln
-12.39%
jan 1, 1999
-9.701 bln
-1.203 bln
14.15%
jan 1, 2001
-2.708 bln
+6.993 bln
-72.08%
jan 1, 2002
-9.755 bln
-7.047 bln
260.21%
jan 1, 2003
-9.042 bln
+712.775 mln
-7.31%
jan 1, 2004
-14.176 bln
-5.134 bln
56.78%
jan 1, 2005
-13.983 bln
+192.933 mln
-1.36%
jan 1, 2006
-11.022 bln
+2.961 bln
-21.17%
jan 1, 2007
19.94 bln
+30.963 bln
-280.91%
jan 1, 2008
-12.317 bln
-32.257 bln
-161.77%
jan 1, 2009
3.988 bln
+16.305 bln
-132.38%
jan 1, 2010
-7.228 bln
-11.216 bln
-281.24%
jan 1, 2011
39.857 bln
+47.085 bln
-651.43%
jan 1, 2012
38.841 bln
-1.016 bln
-2.55%
jan 1, 2013
83.332 bln
+44.49 bln
114.54%
jan 1, 2014
35.821 bln
-47.511 bln
-57.01%
jan 1, 2015
60.356 bln
+24.536 bln
68.5%
Ranking of countries by current statistics by years


Comments: