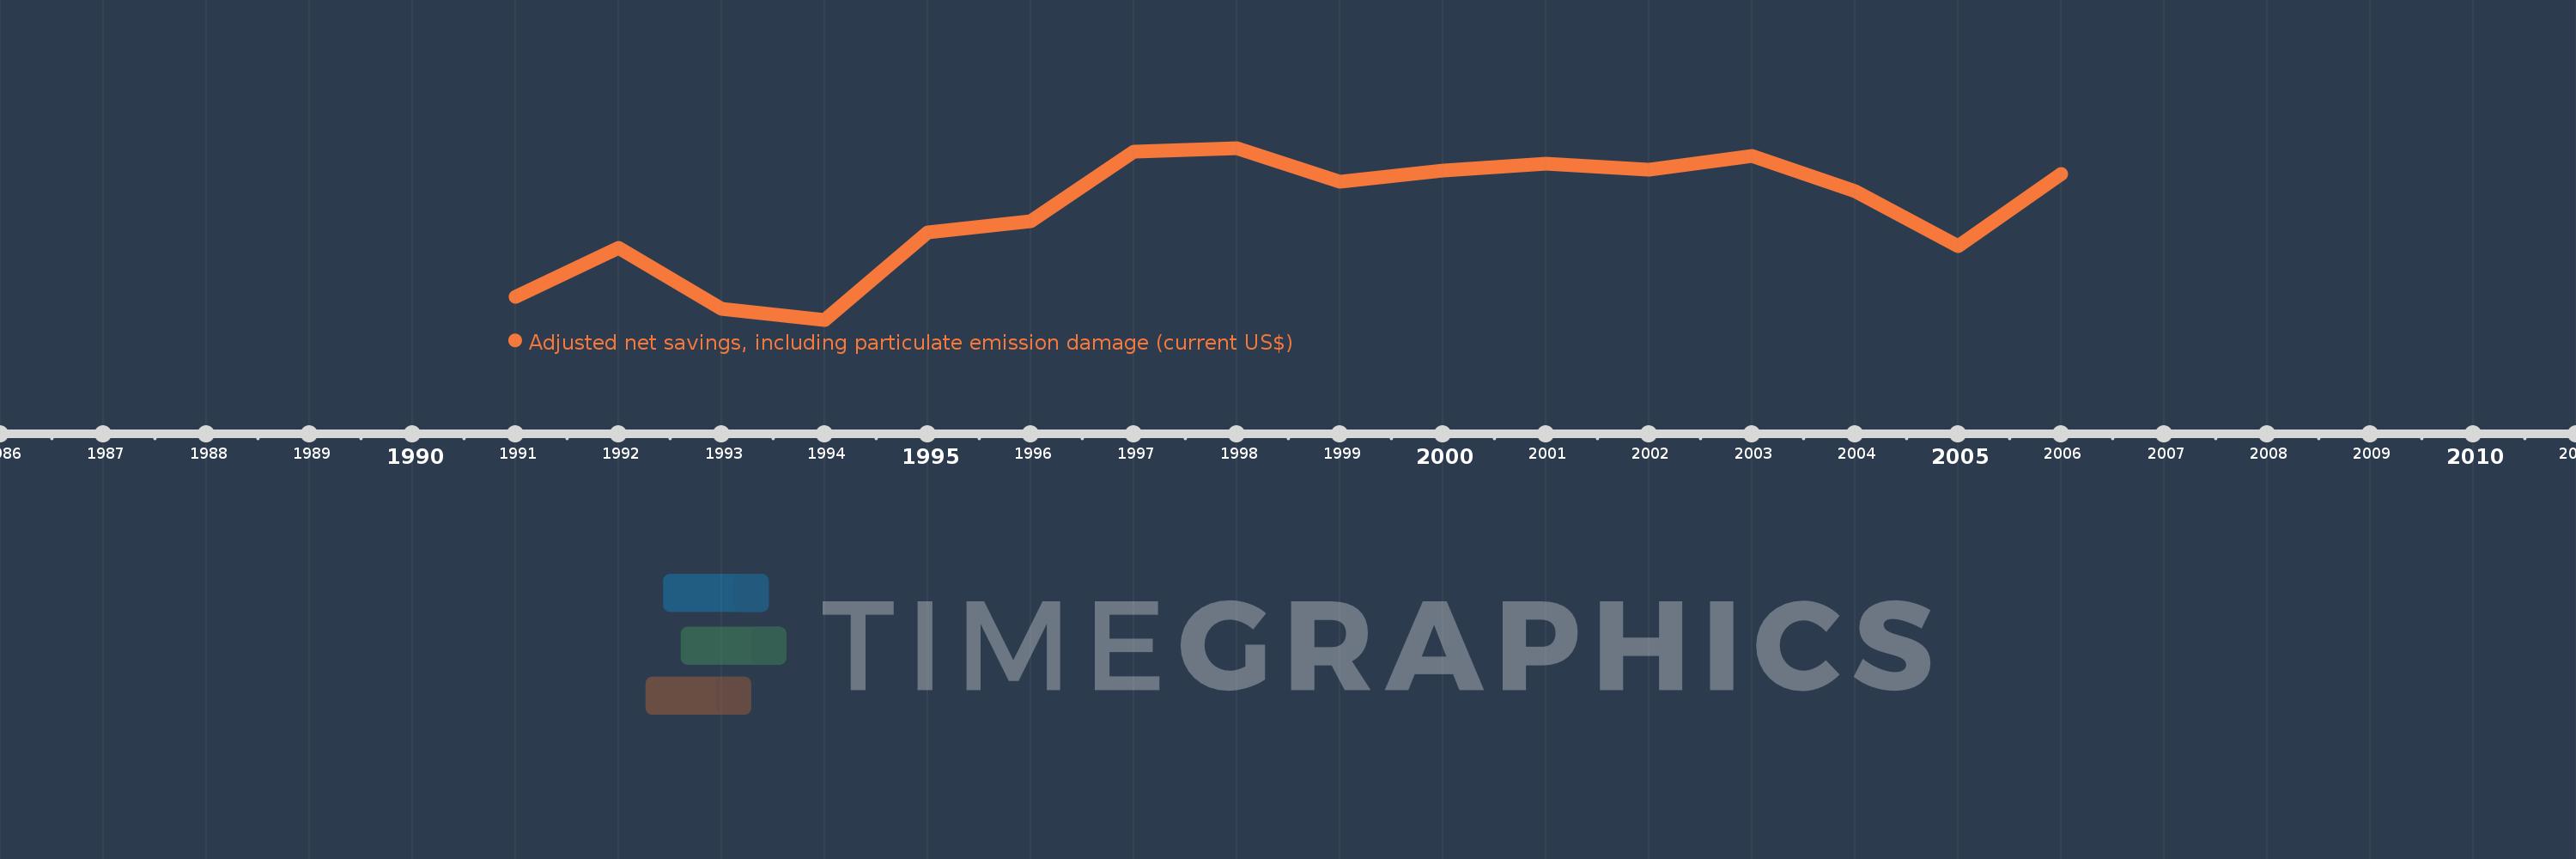
This timeline shows a graph from 1991 to 2006 of Gabon. No data until 1990. Number of actual observations by date: 16.
Source name:
World Development Indicators
Source organization:
World Bank staff estimates based on sources and methods in World Bank's "The Changing Wealth of Nations: Measuring Sustainable Development in the New Millennium" (2011).
Categories, topics:
Economy & Growth, Environment
Last updated:
apr 23, 2017
Indicators value changes by year
Meaning:
-437.699 mln
Minimum:
-1.192 bln
jan 1, 1994
Maximum:
1.705 mln
jan 1, 1998
At the date of observation
Value
Absolute change
Change from the previous value
jan 1, 1991
-1.034 bln
-1.034 bln
0.0%
jan 1, 1992
-693.277 mln
+340.409 mln
-32.93%
jan 1, 1993
-1.117 bln
-423.65 mln
61.11%
jan 1, 1994
-1.192 bln
-75.271 mln
6.74%
jan 1, 1995
-585.575 mln
+606.624 mln
-50.88%
jan 1, 1996
-505.918 mln
+79.657 mln
-13.6%
jan 1, 1997
-21.837 mln
+484.082 mln
-95.68%
jan 1, 1998
1.705 mln
+23.542 mln
-107.81%
jan 1, 1999
-232.572 mln
-234.277 mln
-13.74K%
jan 1, 2000
-154.29 mln
+78.282 mln
-33.66%
jan 1, 2001
-105.39 mln
+48.9 mln
-31.69%
jan 1, 2002
-149.083 mln
-43.692 mln
41.46%
jan 1, 2003
-55.45 mln
+93.633 mln
-62.81%
jan 1, 2004
-299.291 mln
-243.842 mln
439.75%
jan 1, 2005
-679.991 mln
-380.7 mln
127.2%
jan 1, 2006
-179.403 mln
+500.588 mln
-73.62%
Ranking of countries by current statistics by years
