29
/
en
AIzaSyAYiBZKx7MnpbEhh9jyipgxe19OcubqV5w
April 1, 2024
275378
United Kingdom
GBR
true
2
1
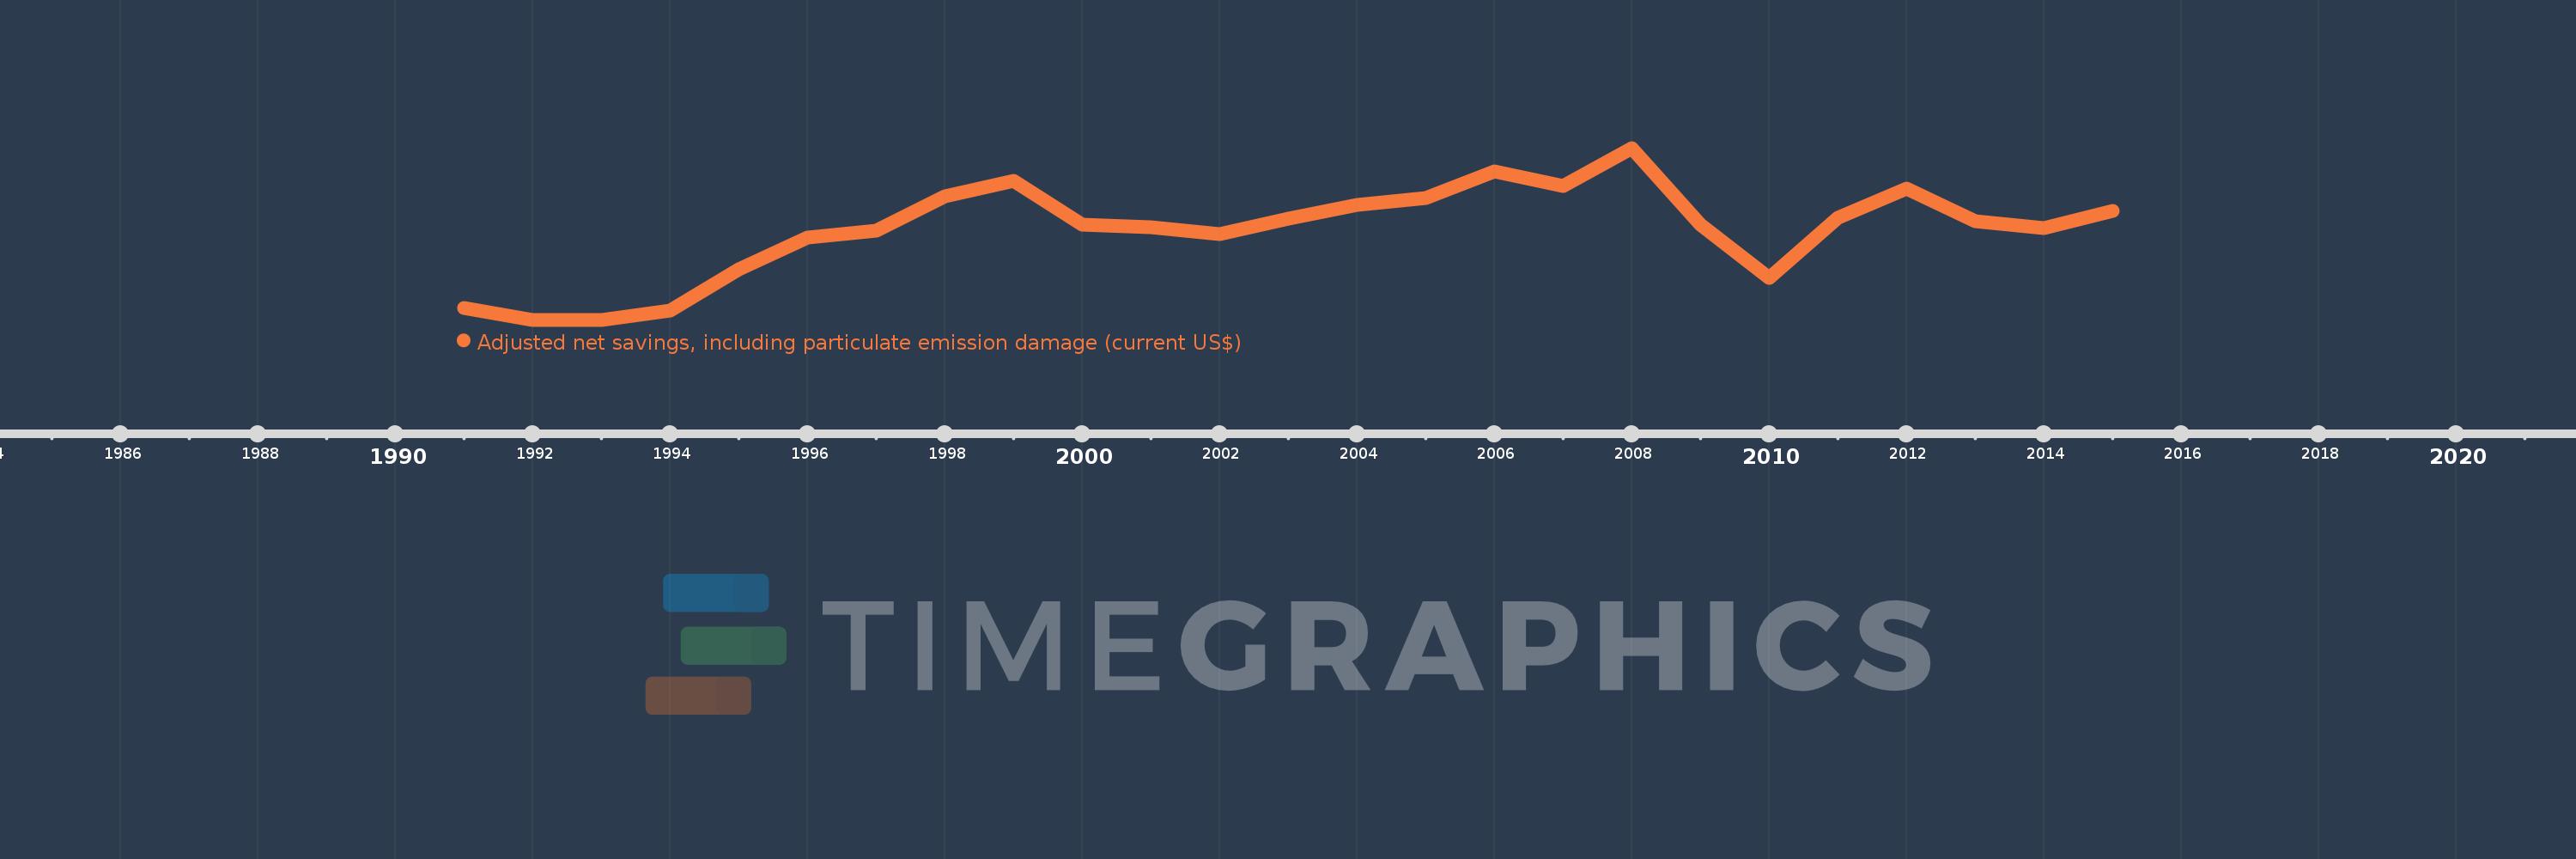
Adjusted net savings, including particulate emission damage (current US$)
2015,2014,2013,2012,2011,2010,2009,2008,2007,2006,2005,2004,2003,2002,2001,2000,1999,1998,1997,1996,1995,1994,1993,1992,1991
This statistics in other country:
AfghanistanAlbaniaAlgeriaAngolaArgentinaArmeniaAustraliaAustriaAzerbaijanBahamas, TheBahrainBangladeshBarbadosBelarusBelgiumBelizeBeninBhutanBoliviaBotswanaBrazilBrunei DarussalamBulgariaBurkina FasoBurundiCabo VerdeCambodiaCameroonCanadaCentral African RepublicChadChileChinaColombiaComorosCongo, Dem. Rep.Congo, Rep.Costa RicaCote d'IvoireCroatiaCyprusCzech RepublicDenmarkDominican RepublicEcuadorEgypt, Arab Rep.El SalvadorEquatorial GuineaEritreaEstoniaEthiopiaFijiFinlandFranceGabonGambia, TheGeorgiaGermanyGhanaGreeceGuatemalaGuineaGuinea-BissauGuyanaHaitiHondurasHungaryIcelandIndiaIndonesiaIran, Islamic Rep.IraqIrelandIsraelItalyJamaicaJapanJordanKazakhstanKenyaKorea, Rep.KuwaitKyrgyz RepublicLao PDRLatviaLebanonLesothoLiberiaLibyaLithuaniaLuxembourgMacedonia, FYRMadagascarMalawiMalaysiaMaldivesMaliMauritaniaMauritiusMexicoMoldovaMongoliaMoroccoMozambiqueNamibiaNepalNetherlandsNew ZealandNicaraguaNigerNigeriaNorwayOmanPakistanPanamaPapua New GuineaParaguayPeruPhilippinesPolandPortugalQatarRomaniaRussian FederationRwandaSaudi ArabiaSenegalSierra LeoneSingaporeSlovak RepublicSloveniaSolomon IslandsSouth AfricaSpainSri LankaSudanSurinameSwazilandSwedenSwitzerlandSyrian Arab RepublicTajikistanTanzaniaThailandTogoTrinidad and TobagoTunisiaTurkeyUgandaUkraineUnited KingdomUnited StatesUruguayVenezuela, RBVietnamYemen, Rep.ZambiaZimbabwe Timeline:
This timeline shows a graph from 1991 to 2015 of United Kingdom. No data until 1990. Number of actual observations by date: 25.
Source name:
World Development Indicators
Source organization:
World Bank staff estimates based on sources and methods in World Bank's "The Changing Wealth of Nations: Measuring Sustainable Development in the New Millennium" (2011).
Categories, topics:
Economy & Growth, Environment
Last updated:
apr 23, 2017
Indicators value changes by year
Minimum:
3.579 bln
jan 1, 1992
Maximum:
164.939 bln
jan 1, 2008
At the date of observation
Value
Absolute change
Change from previous value
jan 1, 1991
14.354 bln
+14.354 bln
0.0%
jan 1, 1992
3.579 bln
-10.775 bln
-75.07%
jan 1, 1993
3.713 bln
+133.73 mln
3.74%
jan 1, 1994
12.443 bln
+8.73 bln
235.16%
jan 1, 1995
51.272 bln
+38.829 bln
312.06%
jan 1, 1996
80.848 bln
+29.576 bln
57.69%
jan 1, 1997
87.066 bln
+6.218 bln
7.69%
jan 1, 1998
119.727 bln
+32.66 bln
37.51%
jan 1, 1999
133.87 bln
+14.144 bln
11.81%
jan 1, 2000
92.585 bln
-41.286 bln
-30.84%
jan 1, 2001
90.656 bln
-1.929 bln
-2.08%
jan 1, 2002
84.16 bln
-6.496 bln
-7.17%
jan 1, 2003
98.596 bln
+14.436 bln
17.15%
jan 1, 2004
111.75 bln
+13.154 bln
13.34%
jan 1, 2005
117.774 bln
+6.024 bln
5.39%
jan 1, 2006
143.201 bln
+25.427 bln
21.59%
jan 1, 2007
129.397 bln
-13.804 bln
-9.64%
jan 1, 2008
164.939 bln
+35.542 bln
27.47%
jan 1, 2009
93.283 bln
-71.656 bln
-43.44%
jan 1, 2010
42.482 bln
-50.801 bln
-54.46%
jan 1, 2011
99.635 bln
+57.153 bln
134.53%
jan 1, 2012
127.112 bln
+27.478 bln
27.58%
jan 1, 2013
95.863 bln
-31.249 bln
-24.58%
jan 1, 2014
89.722 bln
-6.141 bln
-6.41%
jan 1, 2015
106.139 bln
+16.417 bln
18.3%
Ranking of countries by current statistics by years


Comments: