29
/
en
AIzaSyAYiBZKx7MnpbEhh9jyipgxe19OcubqV5w
April 1, 2024
245168
South Africa
ZAF
true
2
1
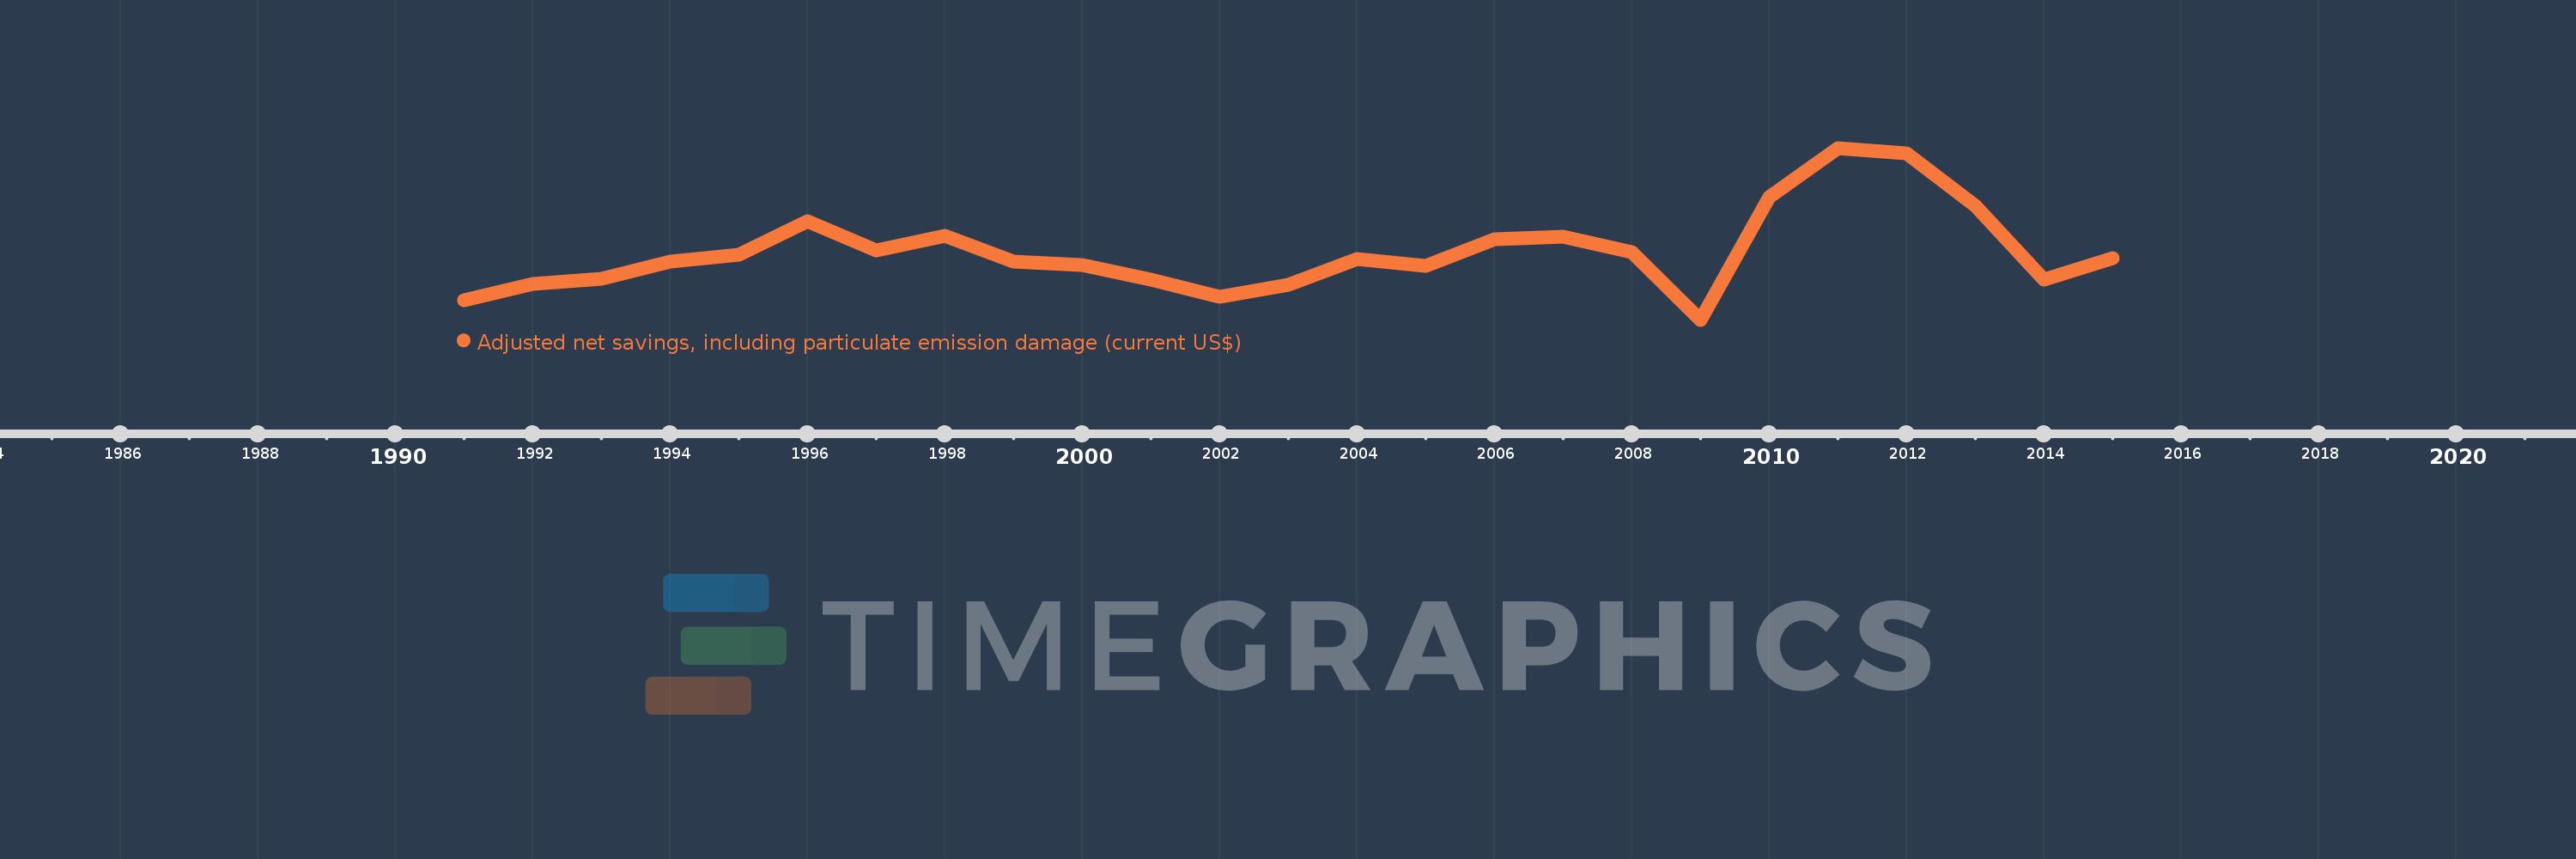
Adjusted net savings, including particulate emission damage (current US$)
2015,2014,2013,2012,2011,2010,2009,2008,2007,2006,2005,2004,2003,2002,2001,2000,1999,1998,1997,1996,1995,1994,1993,1992,1991
This statistics in other country:
AfghanistanAlbaniaAlgeriaAngolaArgentinaArmeniaAustraliaAustriaAzerbaijanBahamas, TheBahrainBangladeshBarbadosBelarusBelgiumBelizeBeninBhutanBoliviaBotswanaBrazilBrunei DarussalamBulgariaBurkina FasoBurundiCabo VerdeCambodiaCameroonCanadaCentral African RepublicChadChileChinaColombiaComorosCongo, Dem. Rep.Congo, Rep.Costa RicaCote d'IvoireCroatiaCyprusCzech RepublicDenmarkDominican RepublicEcuadorEgypt, Arab Rep.El SalvadorEquatorial GuineaEritreaEstoniaEthiopiaFijiFinlandFranceGabonGambia, TheGeorgiaGermanyGhanaGreeceGuatemalaGuineaGuinea-BissauGuyanaHaitiHondurasHungaryIcelandIndiaIndonesiaIran, Islamic Rep.IraqIrelandIsraelItalyJamaicaJapanJordanKazakhstanKenyaKorea, Rep.KuwaitKyrgyz RepublicLao PDRLatviaLebanonLesothoLiberiaLibyaLithuaniaLuxembourgMacedonia, FYRMadagascarMalawiMalaysiaMaldivesMaliMauritaniaMauritiusMexicoMoldovaMongoliaMoroccoMozambiqueNamibiaNepalNetherlandsNew ZealandNicaraguaNigerNigeriaNorwayOmanPakistanPanamaPapua New GuineaParaguayPeruPhilippinesPolandPortugalQatarRomaniaRussian FederationRwandaSaudi ArabiaSenegalSierra LeoneSingaporeSlovak RepublicSloveniaSolomon IslandsSouth AfricaSpainSri LankaSudanSurinameSwazilandSwedenSwitzerlandSyrian Arab RepublicTajikistanTanzaniaThailandTogoTrinidad and TobagoTunisiaTurkeyUgandaUkraineUnited KingdomUnited StatesUruguayVenezuela, RBVietnamYemen, Rep.ZambiaZimbabwe Timeline:
This timeline shows a graph from 1991 to 2015 of South Africa. No data until 1990. Number of actual observations by date: 25.
Source name:
World Development Indicators
Source organization:
World Bank staff estimates based on sources and methods in World Bank's "The Changing Wealth of Nations: Measuring Sustainable Development in the New Millennium" (2011).
Categories, topics:
Economy & Growth, Environment
Last updated:
apr 23, 2017
Indicators value changes by year
Minimum:
1.735 bln
jan 1, 2009
Maximum:
17.038 bln
jan 1, 2011
At the date of observation
Value
Absolute change
Change from previous value
jan 1, 1991
3.479 bln
+3.479 bln
0.0%
jan 1, 1992
4.907 bln
+1.428 bln
41.06%
jan 1, 1993
5.392 bln
+484.81 mln
9.88%
jan 1, 1994
6.878 bln
+1.486 bln
27.56%
jan 1, 1995
7.503 bln
+625.534 mln
9.09%
jan 1, 1996
10.485 bln
+2.981 bln
39.73%
jan 1, 1997
7.892 bln
-2.593 bln
-24.73%
jan 1, 1998
9.207 bln
+1.316 bln
16.67%
jan 1, 1999
6.891 bln
-2.317 bln
-25.16%
jan 1, 2000
6.576 bln
-314.538 mln
-4.56%
jan 1, 2001
5.314 bln
-1.263 bln
-19.2%
jan 1, 2002
3.746 bln
-1.568 bln
-29.5%
jan 1, 2003
4.875 bln
+1.129 bln
30.14%
jan 1, 2004
7.128 bln
+2.253 bln
46.21%
jan 1, 2005
6.516 bln
-612.069 mln
-8.59%
jan 1, 2006
8.878 bln
+2.362 bln
36.25%
jan 1, 2007
9.129 bln
+250.554 mln
2.82%
jan 1, 2008
7.761 bln
-1.367 bln
-14.98%
jan 1, 2009
1.735 bln
-6.027 bln
-77.65%
jan 1, 2010
12.624 bln
+10.889 bln
627.72%
jan 1, 2011
17.038 bln
+4.414 bln
34.97%
jan 1, 2012
16.565 bln
-473.479 mln
-2.78%
jan 1, 2013
11.921 bln
-4.644 bln
-28.03%
jan 1, 2014
5.331 bln
-6.59 bln
-55.28%
jan 1, 2015
7.25 bln
+1.92 bln
36.01%
Ranking of countries by current statistics by years


Comments: