29
/
en
AIzaSyAYiBZKx7MnpbEhh9jyipgxe19OcubqV5w
April 1, 2024
223124
Philippines
PHL
true
2
1
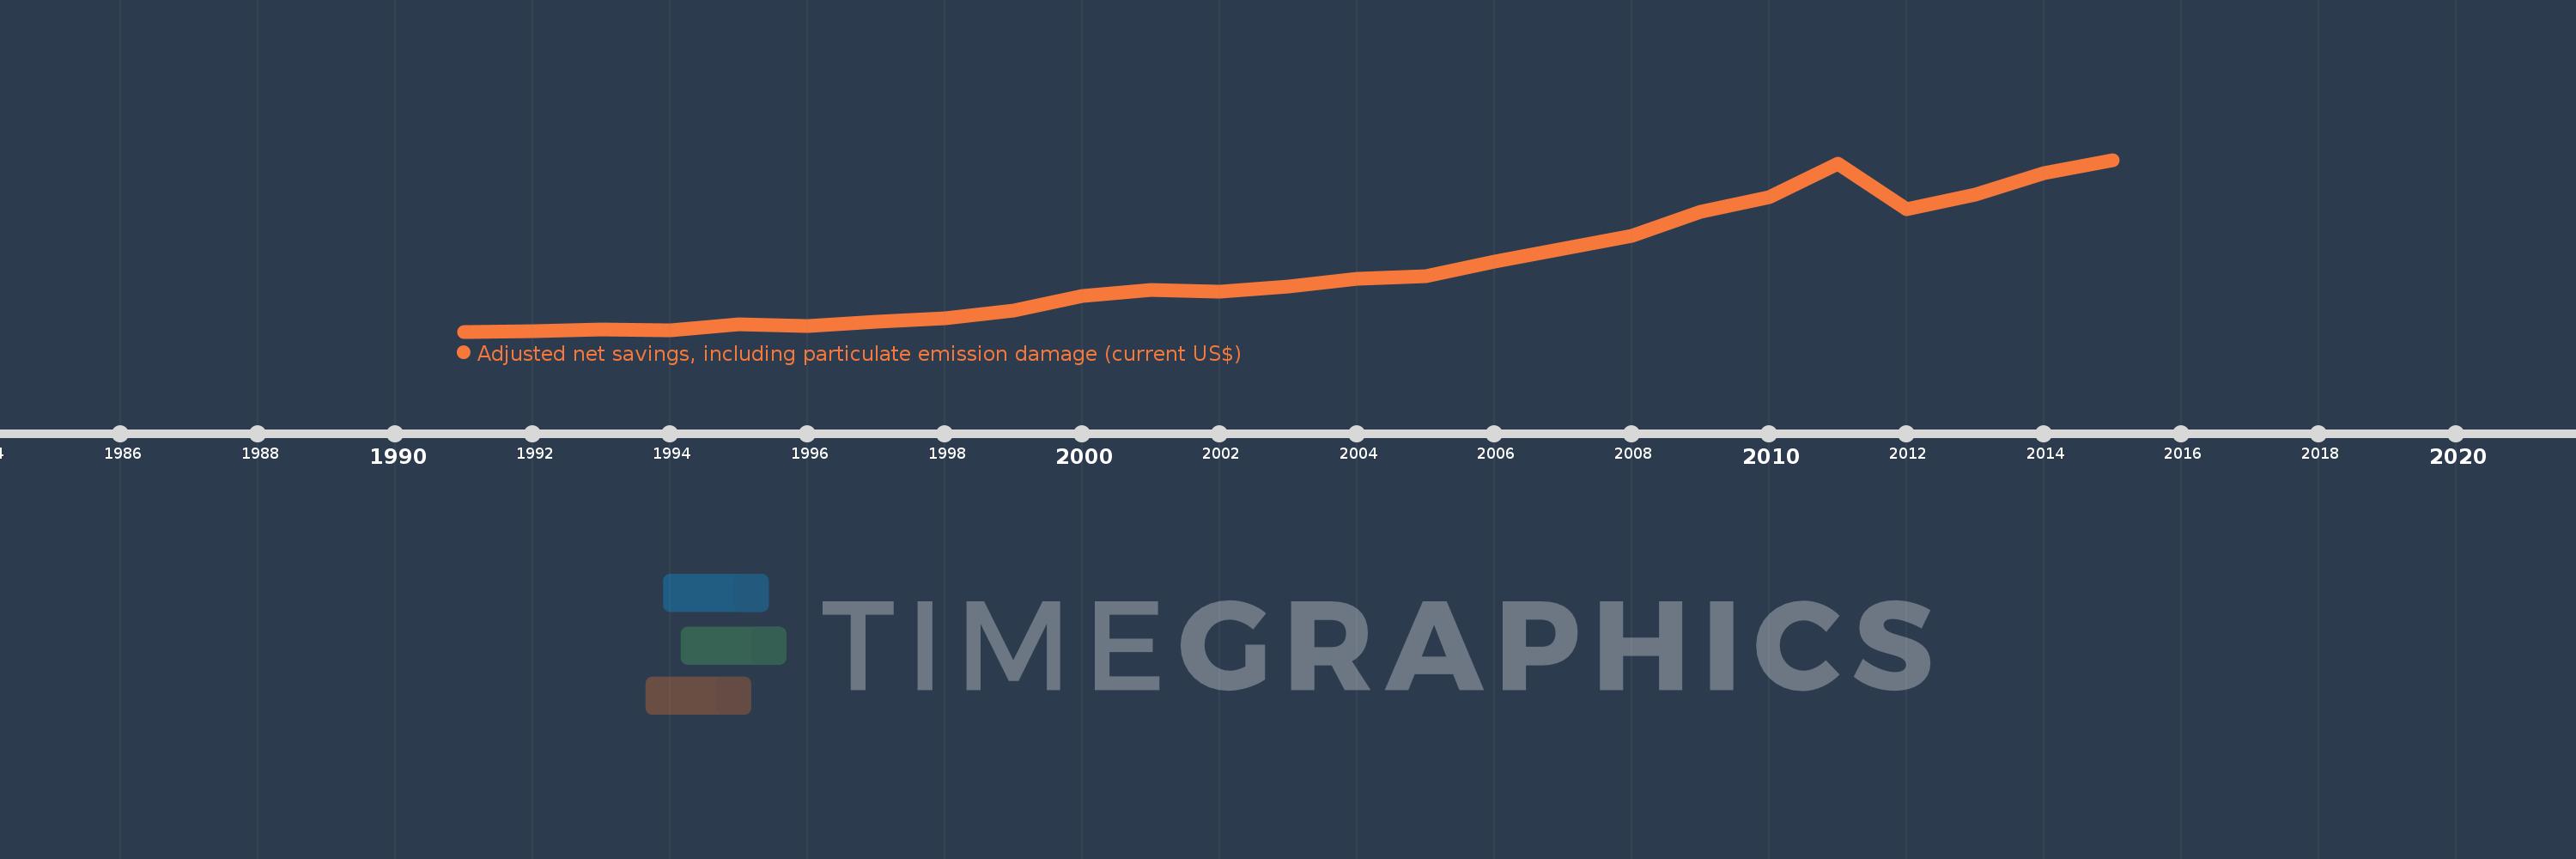
Adjusted net savings, including particulate emission damage (current US$)
2015,2014,2013,2012,2011,2010,2009,2008,2007,2006,2005,2004,2003,2002,2001,2000,1999,1998,1997,1996,1995,1994,1993,1992,1991
This statistics in other country:
AfghanistanAlbaniaAlgeriaAngolaArgentinaArmeniaAustraliaAustriaAzerbaijanBahamas, TheBahrainBangladeshBarbadosBelarusBelgiumBelizeBeninBhutanBoliviaBotswanaBrazilBrunei DarussalamBulgariaBurkina FasoBurundiCabo VerdeCambodiaCameroonCanadaCentral African RepublicChadChileChinaColombiaComorosCongo, Dem. Rep.Congo, Rep.Costa RicaCote d'IvoireCroatiaCyprusCzech RepublicDenmarkDominican RepublicEcuadorEgypt, Arab Rep.El SalvadorEquatorial GuineaEritreaEstoniaEthiopiaFijiFinlandFranceGabonGambia, TheGeorgiaGermanyGhanaGreeceGuatemalaGuineaGuinea-BissauGuyanaHaitiHondurasHungaryIcelandIndiaIndonesiaIran, Islamic Rep.IraqIrelandIsraelItalyJamaicaJapanJordanKazakhstanKenyaKorea, Rep.KuwaitKyrgyz RepublicLao PDRLatviaLebanonLesothoLiberiaLibyaLithuaniaLuxembourgMacedonia, FYRMadagascarMalawiMalaysiaMaldivesMaliMauritaniaMauritiusMexicoMoldovaMongoliaMoroccoMozambiqueNamibiaNepalNetherlandsNew ZealandNicaraguaNigerNigeriaNorwayOmanPakistanPanamaPapua New GuineaParaguayPeruPhilippinesPolandPortugalQatarRomaniaRussian FederationRwandaSaudi ArabiaSenegalSierra LeoneSingaporeSlovak RepublicSloveniaSolomon IslandsSouth AfricaSpainSri LankaSudanSurinameSwazilandSwedenSwitzerlandSyrian Arab RepublicTajikistanTanzaniaThailandTogoTrinidad and TobagoTunisiaTurkeyUgandaUkraineUnited KingdomUnited StatesUruguayVenezuela, RBVietnamYemen, Rep.ZambiaZimbabwe Timeline:
This timeline shows a graph from 1991 to 2015 of Philippines. No data until 1990. Number of actual observations by date: 25.
Source name:
World Development Indicators
Source organization:
World Bank staff estimates based on sources and methods in World Bank's "The Changing Wealth of Nations: Measuring Sustainable Development in the New Millennium" (2011).
Categories, topics:
Economy & Growth, Environment
Last updated:
apr 23, 2017
Indicators value changes by year
Minimum:
4.424 bln
jan 1, 1991
Maximum:
99.063 bln
jan 1, 2015
At the date of observation
Value
Absolute change
Change from previous value
jan 1, 1991
4.424 bln
+4.424 bln
0.0%
jan 1, 1992
4.683 bln
+258.631 mln
5.85%
jan 1, 1993
5.717 bln
+1.034 bln
22.07%
jan 1, 1994
5.258 bln
-458.769 mln
-8.03%
jan 1, 1995
8.536 bln
+3.278 bln
62.35%
jan 1, 1996
7.656 bln
-880.04 mln
-10.31%
jan 1, 1997
9.982 bln
+2.326 bln
30.38%
jan 1, 1998
11.548 bln
+1.566 bln
15.69%
jan 1, 1999
15.867 bln
+4.318 bln
37.39%
jan 1, 2000
23.987 bln
+8.121 bln
51.18%
jan 1, 2001
27.284 bln
+3.297 bln
13.74%
jan 1, 2002
26.567 bln
-716.973 mln
-2.63%
jan 1, 2003
29.167 bln
+2.6 bln
9.79%
jan 1, 2004
33.396 bln
+4.228 bln
14.5%
jan 1, 2005
34.846 bln
+1.45 bln
4.34%
jan 1, 2006
42.828 bln
+7.983 bln
22.91%
jan 1, 2007
49.872 bln
+7.044 bln
16.45%
jan 1, 2008
56.976 bln
+7.104 bln
14.24%
jan 1, 2009
70.488 bln
+13.512 bln
23.72%
jan 1, 2010
78.583 bln
+8.095 bln
11.48%
jan 1, 2011
96.832 bln
+18.249 bln
23.22%
jan 1, 2012
71.979 bln
-24.853 bln
-25.67%
jan 1, 2013
79.73 bln
+7.751 bln
10.77%
jan 1, 2014
91.956 bln
+12.226 bln
15.33%
jan 1, 2015
99.063 bln
+7.106 bln
7.73%
Ranking of countries by current statistics by years


Comments: