29
/
en
AIzaSyAYiBZKx7MnpbEhh9jyipgxe19OcubqV5w
April 1, 2024
68611
Antigua and Barbuda
ATG
true
2
1
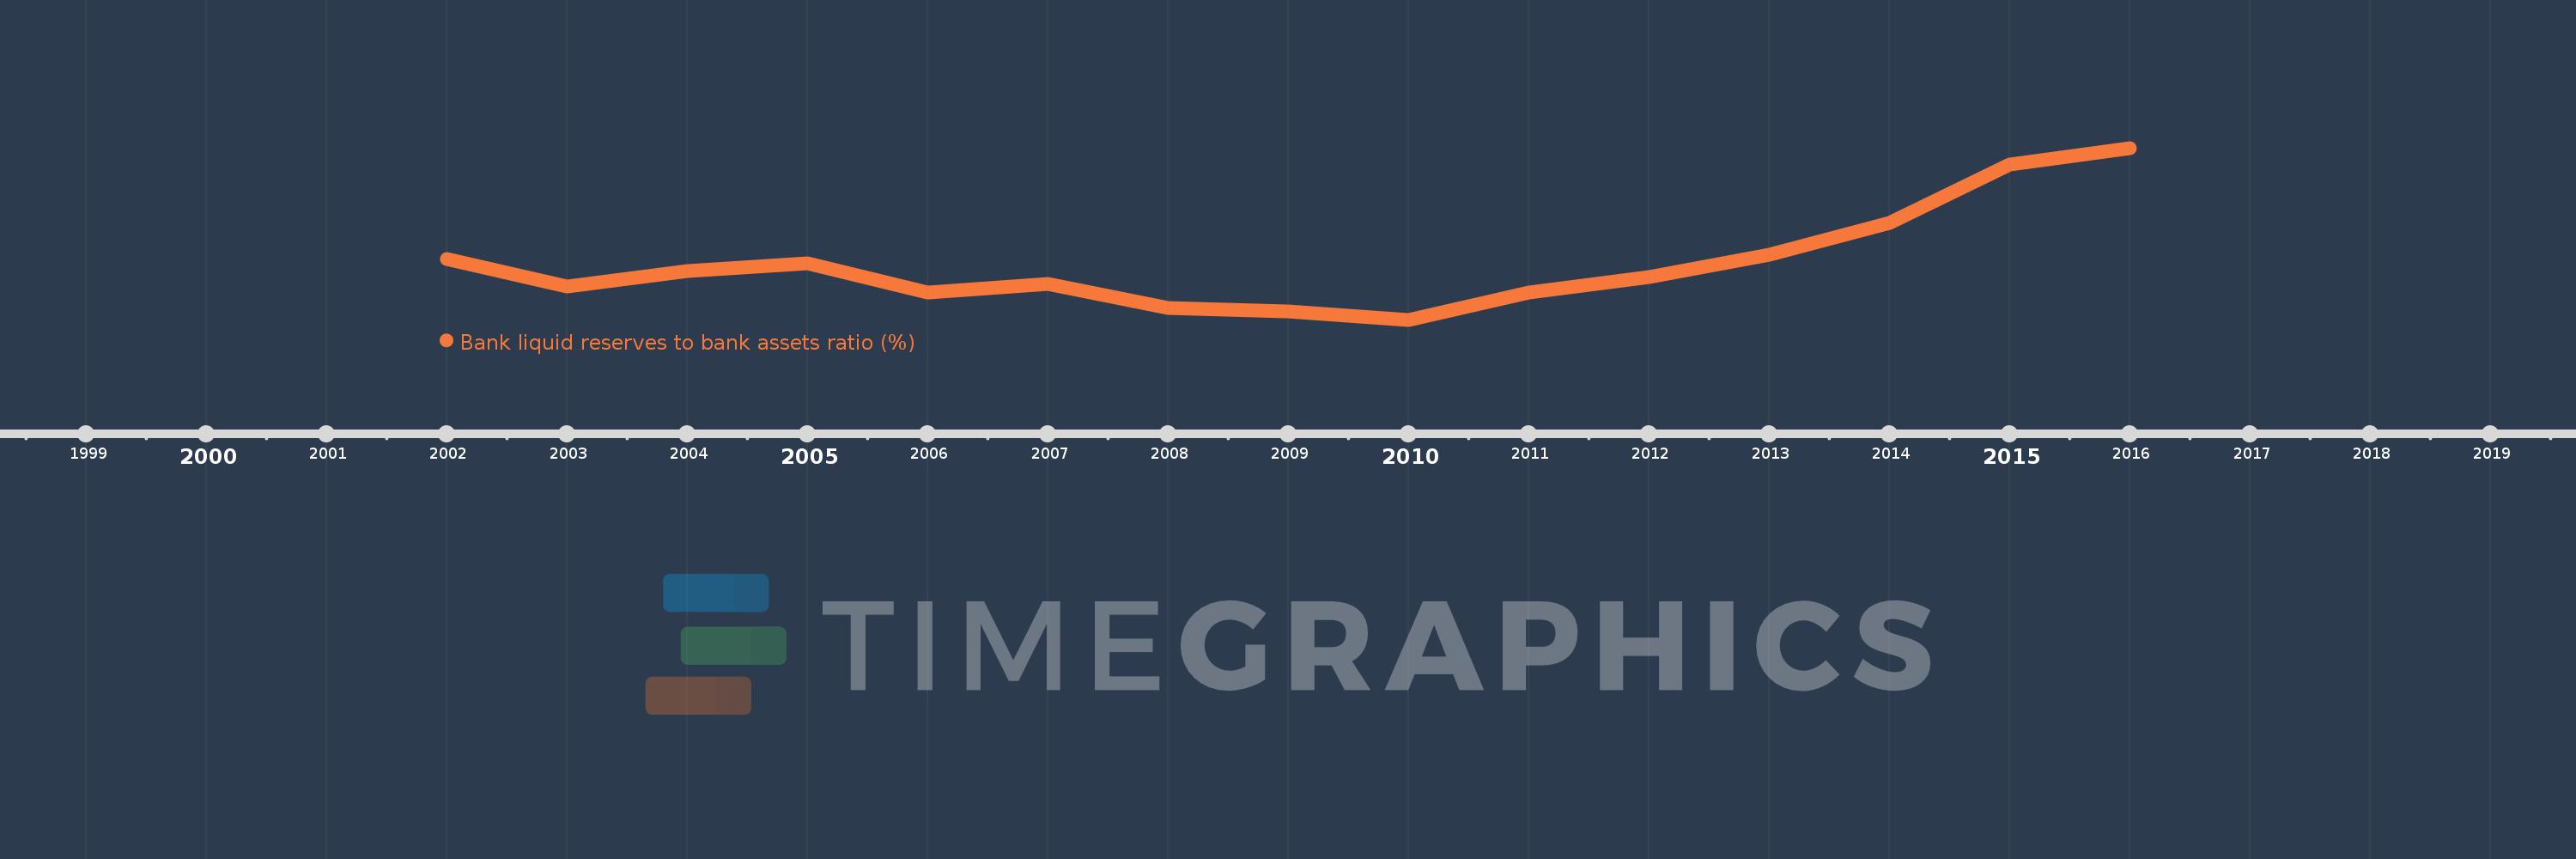
Bank liquid reserves to bank assets ratio (%)
2016,2015,2014,2013,2012,2011,2010,2009,2008,2007,2006,2005,2004,2003,2002
This statistics in other country:
Timeline:
This timeline shows a graph from 2002 to 2016 of Antigua and Barbuda. No data until 2001. Number of actual observations by date: 15.
Source name:
World Development Indicators
Source organization:
International Monetary Fund, International Financial Statistics and data files.
Categories, topics:
Financial Sector
Last updated:
apr 23, 2017
Indicators value changes by year
Maximum:
17.714
jan 1, 2016
At the date of observation
Value
Absolute change
Change from previous value
jan 1, 2002
9.798
+9.798
0.0%
jan 1, 2003
7.852
-1.946
-19.86%
jan 1, 2004
8.927
+1.076
13.7%
jan 1, 2005
9.501
+0.574
6.43%
jan 1, 2006
7.414
-2.086
-21.96%
jan 1, 2007
8.056
+0.642
8.66%
jan 1, 2008
6.331
-1.725
-21.41%
jan 1, 2009
6.079
-0.252
-3.98%
jan 1, 2010
5.482
-0.596
-9.81%
jan 1, 2011
7.431
+1.948
35.53%
jan 1, 2012
8.519
+1.089
14.65%
jan 1, 2013
10.118
+1.598
18.76%
jan 1, 2014
12.379
+2.261
22.35%
jan 1, 2015
16.549
+4.171
33.69%
jan 1, 2016
17.714
+1.165
7.04%
Ranking of countries by current statistics by years


Comments: