29
/
en
AIzaSyAYiBZKx7MnpbEhh9jyipgxe19OcubqV5w
April 1, 2024
170688
Kosovo
XKX
true
2
1
Bank liquid reserves to bank assets ratio (%)
2016,2015,2014,2013,2012,2011,2010,2009,2008,2007,2006,2005,2004,2003,2002
This statistics in other country:
Timeline:
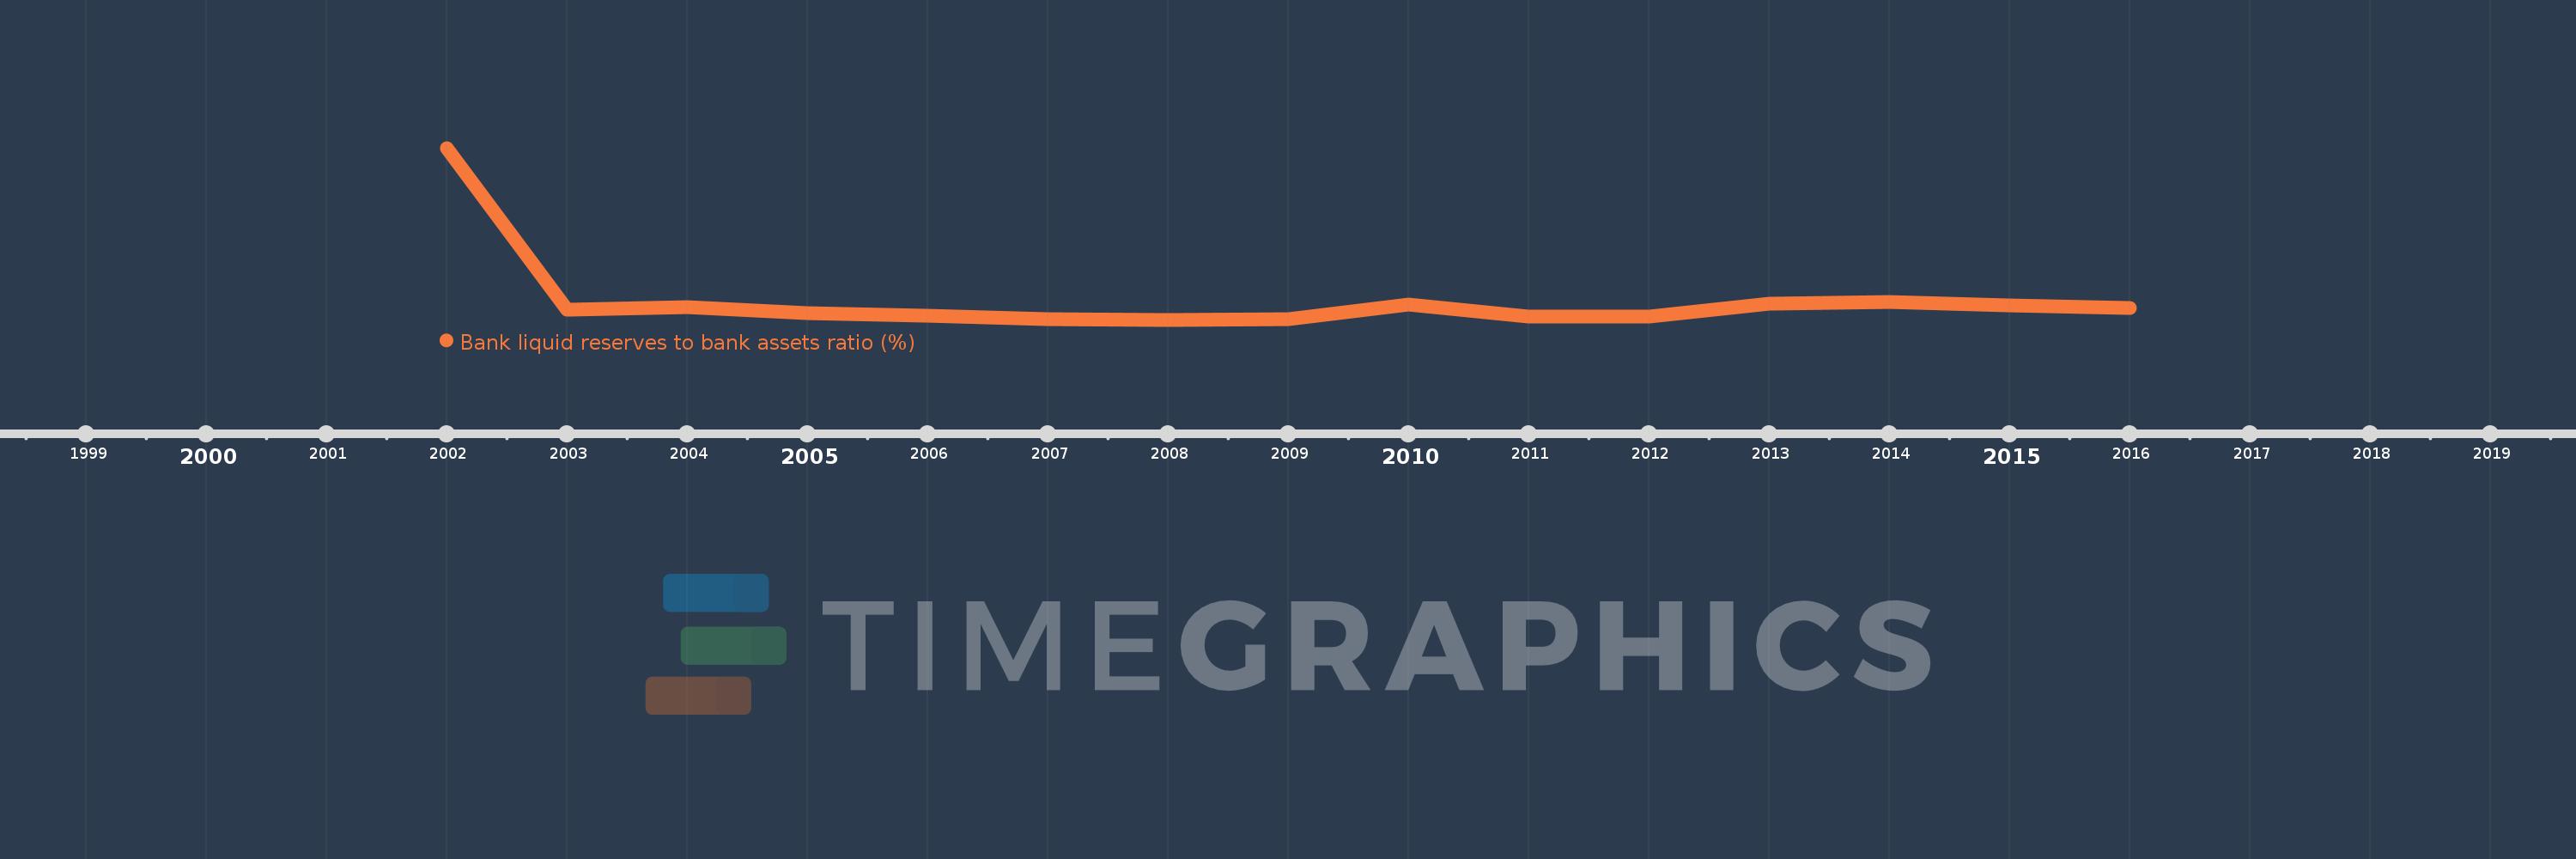
This timeline shows a graph from 2002 to 2016 of Kosovo. No data until 2001. Number of actual observations by date: 15.
Source name:
World Development Indicators
Source organization:
International Monetary Fund, International Financial Statistics and data files.
Categories, topics:
Financial Sector
Last updated:
apr 23, 2017
Indicators value changes by year
Maximum:
52.851
jan 1, 2002
At the date of observation
Value
Absolute change
Change from previous value
jan 1, 2002
52.851
+52.851
0.0%
jan 1, 2003
11.026
-41.825
-79.14%
jan 1, 2004
11.791
+0.764
6.93%
jan 1, 2005
10.293
-1.498
-12.71%
jan 1, 2006
9.484
-0.809
-7.86%
jan 1, 2007
8.609
-0.875
-9.23%
jan 1, 2008
8.53
-0.079
-0.92%
jan 1, 2009
8.633
+0.103
1.2%
jan 1, 2010
12.451
+3.818
44.23%
jan 1, 2011
9.391
-3.06
-24.58%
jan 1, 2012
9.436
+0.045
0.48%
jan 1, 2013
12.702
+3.266
34.61%
jan 1, 2014
13.111
+0.41
3.23%
jan 1, 2015
12.175
-0.937
-7.15%
jan 1, 2016
11.456
-0.718
-5.9%
Ranking of countries by current statistics by years


Comments: