29
/
en
AIzaSyAYiBZKx7MnpbEhh9jyipgxe19OcubqV5w
April 1, 2024
53236
Other small states
OSS
false
2
1
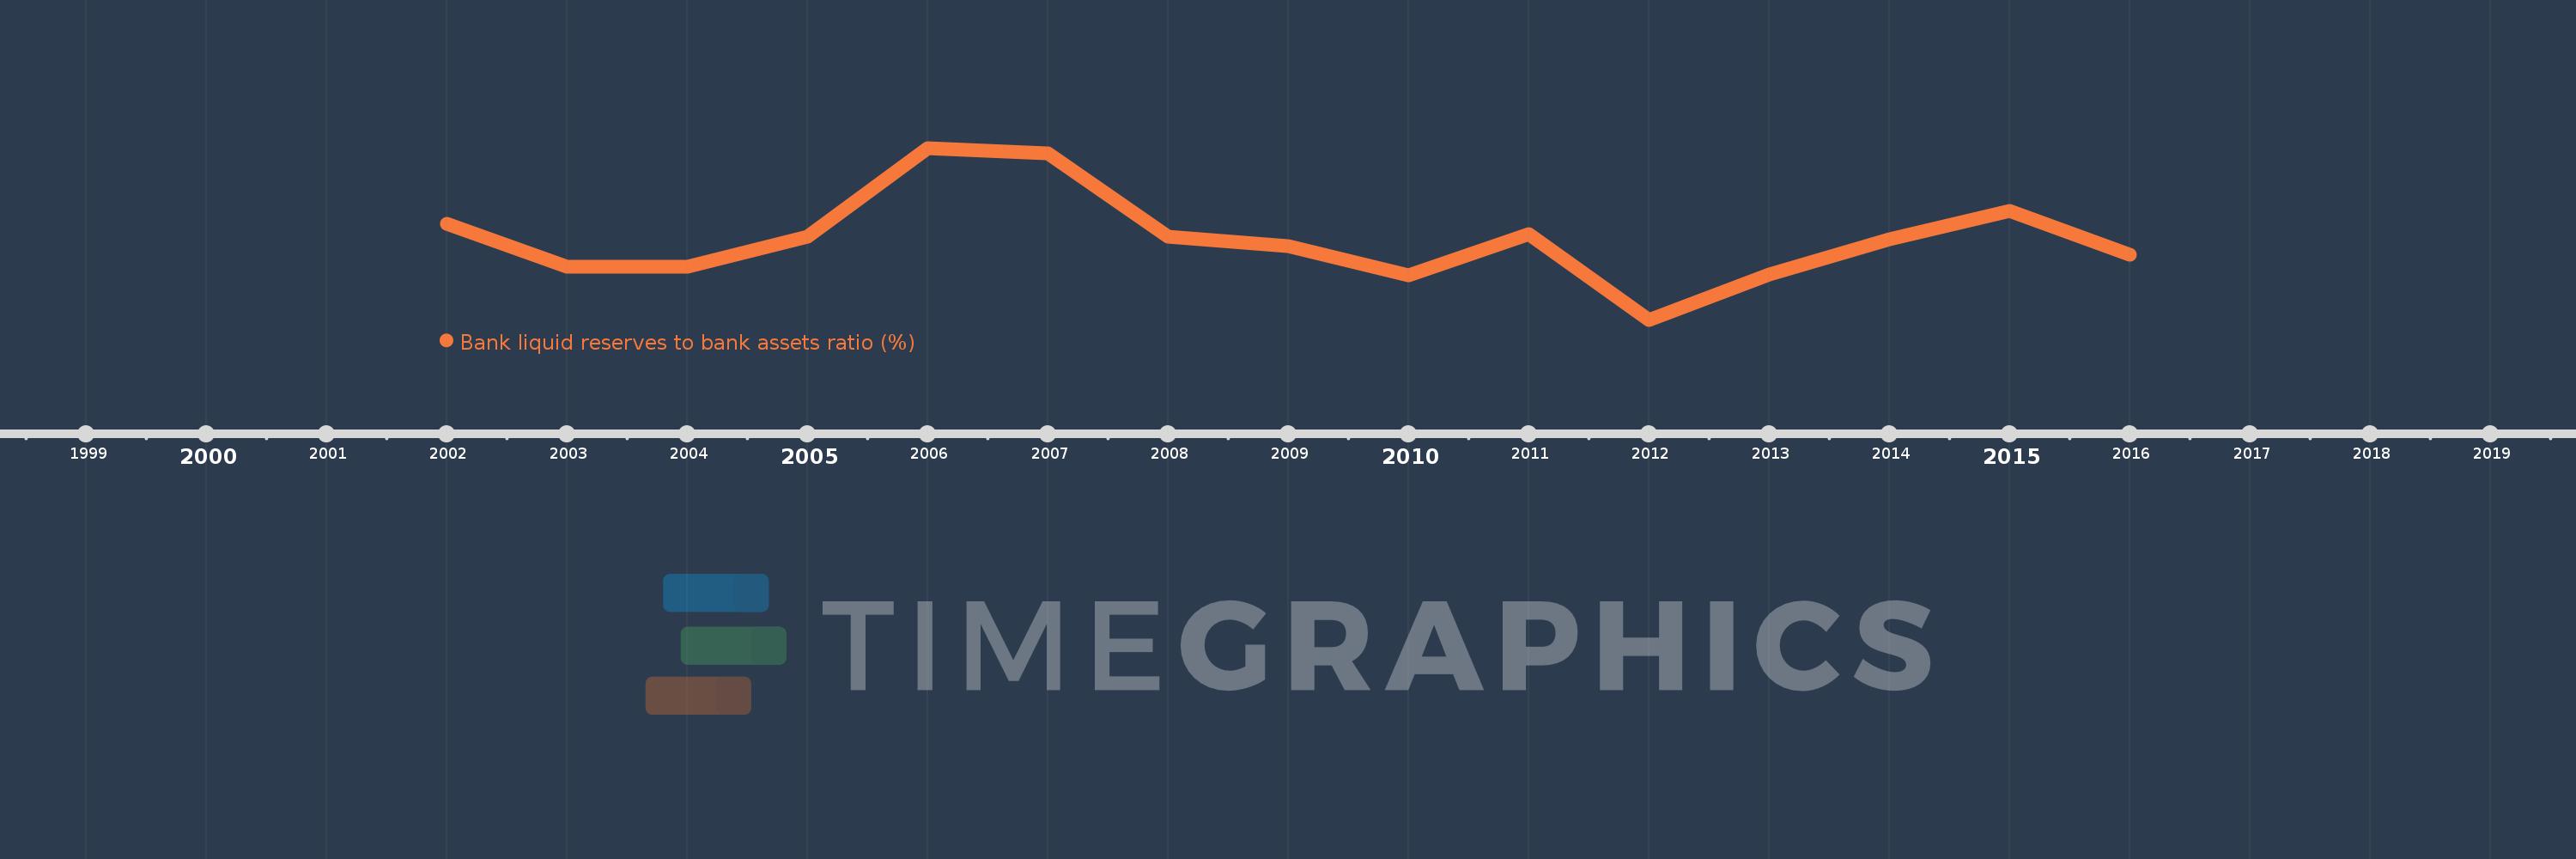
Bank liquid reserves to bank assets ratio (%)
2016,2015,2014,2013,2012,2011,2010,2009,2008,2007,2006,2005,2004,2003,2002
This statistics in other country:
Timeline:
This timeline shows a graph from 2002 to 2016 of Other small states. No data until 2001. Number of actual observations by date: 15.
Source name:
World Development Indicators
Source organization:
International Monetary Fund, International Financial Statistics and data files.
Categories, topics:
Financial Sector
Last updated:
apr 23, 2017
Indicators value changes by year
Minimum:
15.317
jan 1, 2012
Maximum:
26.022
jan 1, 2006
At the date of observation
Value
Absolute change
Change from previous value
jan 1, 2002
21.288
+21.288
0.0%
jan 1, 2003
18.621
-2.667
-12.53%
jan 1, 2004
18.64
+0.019
0.1%
jan 1, 2005
20.495
+1.854
9.95%
jan 1, 2006
26.022
+5.528
26.97%
jan 1, 2007
25.688
-0.334
-1.29%
jan 1, 2008
20.504
-5.184
-20.18%
jan 1, 2009
19.928
-0.576
-2.81%
jan 1, 2010
18.087
-1.841
-9.24%
jan 1, 2011
20.66
+2.572
14.22%
jan 1, 2012
15.317
-5.343
-25.86%
jan 1, 2013
18.131
+2.815
18.38%
jan 1, 2014
20.317
+2.185
12.05%
jan 1, 2015
22.098
+1.782
8.77%
jan 1, 2016
19.353
-2.746
-12.42%
Ranking of countries by current statistics by years


Comments: