29
/
en
AIzaSyAYiBZKx7MnpbEhh9jyipgxe19OcubqV5w
April 1, 2024
83763
Benin
BEN
true
2
1
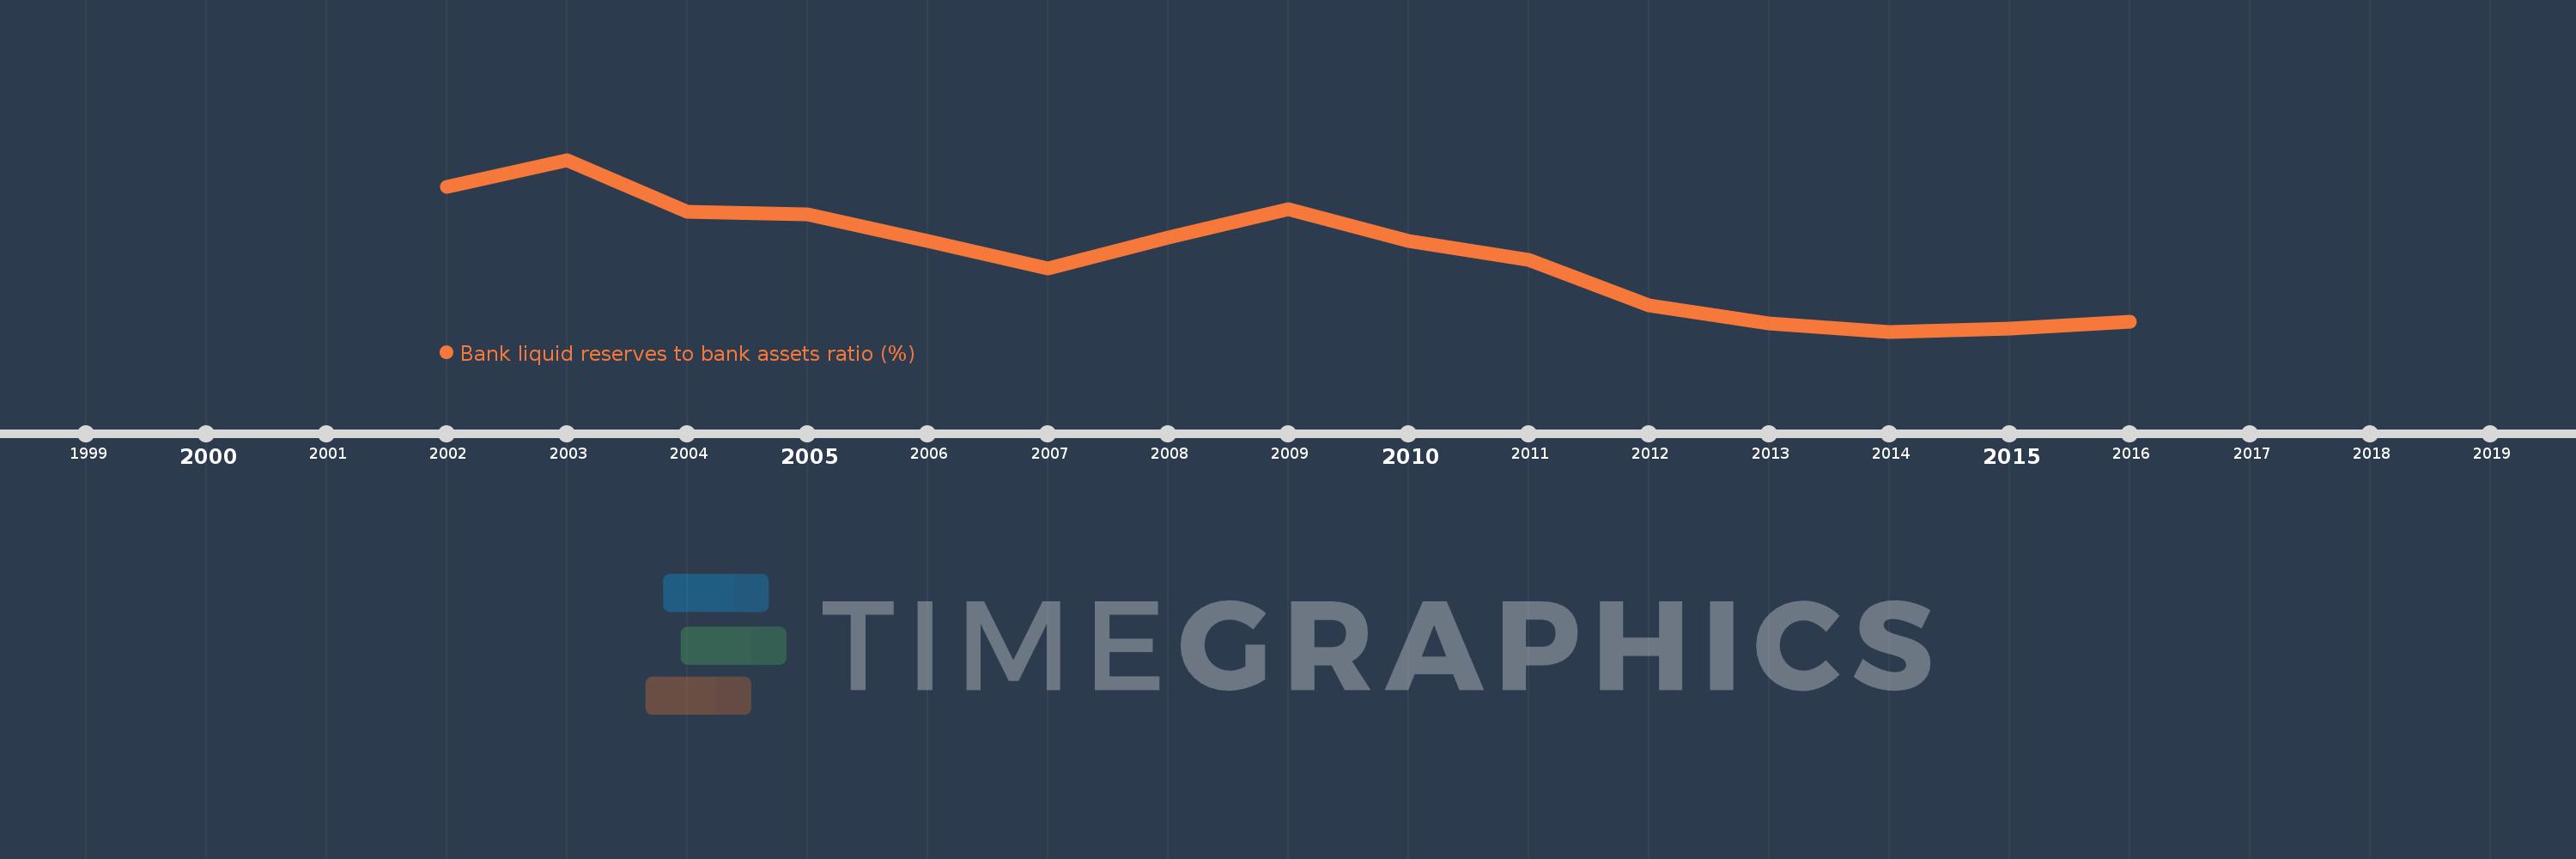
Bank liquid reserves to bank assets ratio (%)
2016,2015,2014,2013,2012,2011,2010,2009,2008,2007,2006,2005,2004,2003,2002
This statistics in other country:
Timeline:
This timeline shows a graph from 2002 to 2016 of Benin. No data until 2001. Number of actual observations by date: 15.
Source name:
World Development Indicators
Source organization:
International Monetary Fund, International Financial Statistics and data files.
Categories, topics:
Financial Sector
Last updated:
apr 23, 2017
Indicators value changes by year
Maximum:
23.368
jan 1, 2003
At the date of observation
Value
Absolute change
Change from previous value
jan 1, 2002
20.538
+20.538
0.0%
jan 1, 2003
23.368
+2.831
13.78%
jan 1, 2004
17.901
-5.467
-23.4%
jan 1, 2005
17.662
-0.239
-1.33%
jan 1, 2006
14.859
-2.804
-15.87%
jan 1, 2007
11.941
-2.918
-19.64%
jan 1, 2008
15.214
+3.273
27.41%
jan 1, 2009
18.169
+2.955
19.42%
jan 1, 2010
14.861
-3.307
-18.2%
jan 1, 2011
12.906
-1.955
-13.15%
jan 1, 2012
8.104
-4.802
-37.21%
jan 1, 2013
6.199
-1.905
-23.51%
jan 1, 2014
5.352
-0.847
-13.66%
jan 1, 2015
5.678
+0.326
6.09%
jan 1, 2016
6.394
+0.716
12.6%
Ranking of countries by current statistics by years


Comments: