29
/
en
AIzaSyAYiBZKx7MnpbEhh9jyipgxe19OcubqV5w
April 1, 2024
40515
Late-demographic dividend
LTE
false
2
1
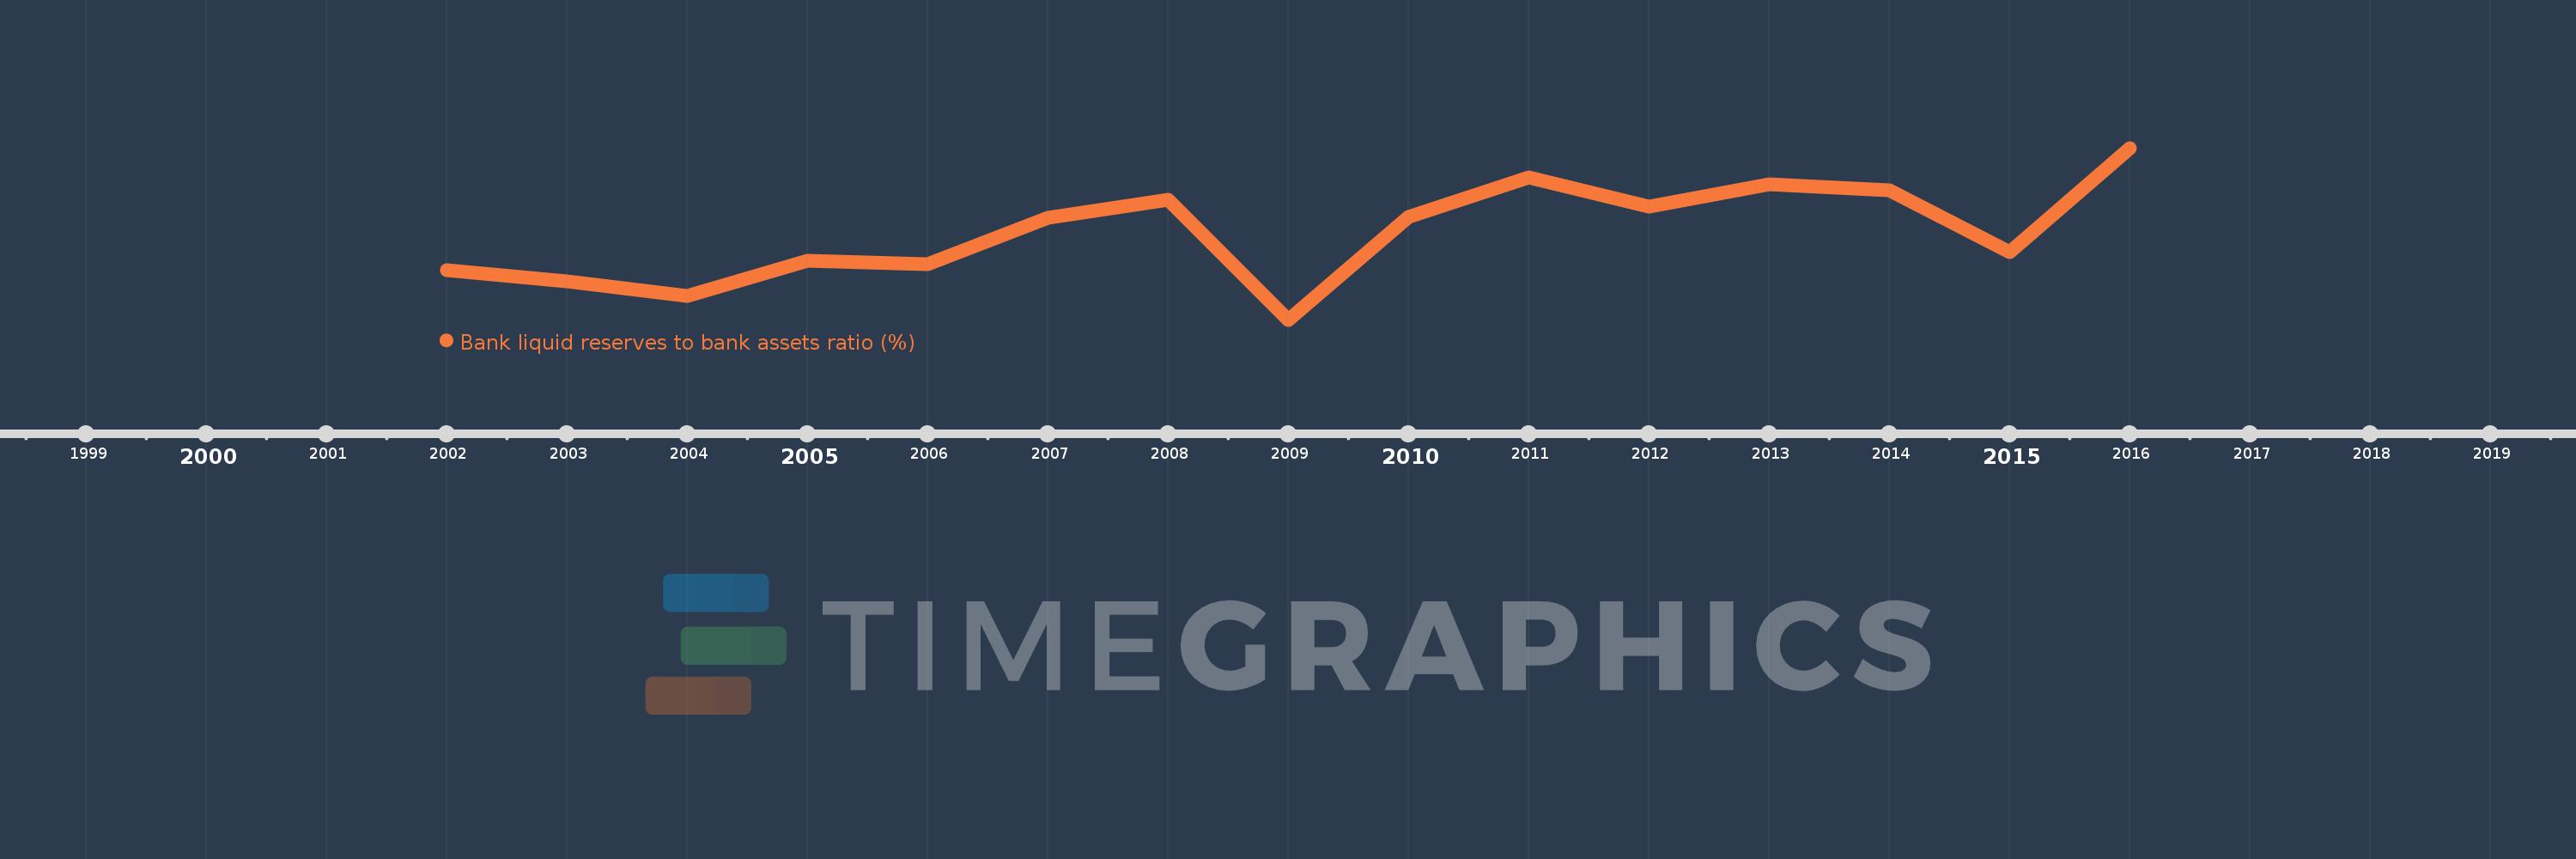
Bank liquid reserves to bank assets ratio (%)
2016,2015,2014,2013,2012,2011,2010,2009,2008,2007,2006,2005,2004,2003,2002
This statistics in other country:
Timeline:
This timeline shows a graph from 2002 to 2016 of Late-demographic dividend. No data until 2001. Number of actual observations by date: 15.
Source name:
World Development Indicators
Source organization:
International Monetary Fund, International Financial Statistics and data files.
Categories, topics:
Financial Sector
Last updated:
apr 23, 2017
Indicators value changes by year
Minimum:
11.677
jan 1, 2009
Maximum:
17.143
jan 1, 2016
At the date of observation
Value
Absolute change
Change from previous value
jan 1, 2002
13.244
+13.244
0.0%
jan 1, 2003
12.91
-0.334
-2.52%
jan 1, 2004
12.439
-0.47
-3.64%
jan 1, 2005
13.564
+1.124
9.04%
jan 1, 2006
13.442
-0.121
-0.89%
jan 1, 2007
14.932
+1.49
11.08%
jan 1, 2008
15.488
+0.556
3.72%
jan 1, 2009
11.677
-3.811
-24.6%
jan 1, 2010
14.945
+3.268
27.99%
jan 1, 2011
16.214
+1.269
8.49%
jan 1, 2012
15.284
-0.93
-5.74%
jan 1, 2013
15.983
+0.699
4.58%
jan 1, 2014
15.806
-0.178
-1.11%
jan 1, 2015
13.84
-1.966
-12.44%
jan 1, 2016
17.143
+3.303
23.87%
Ranking of countries by current statistics by years


Comments: