29
/
en
AIzaSyAYiBZKx7MnpbEhh9jyipgxe19OcubqV5w
April 1, 2024
245257
South Africa
ZAF
true
2
1
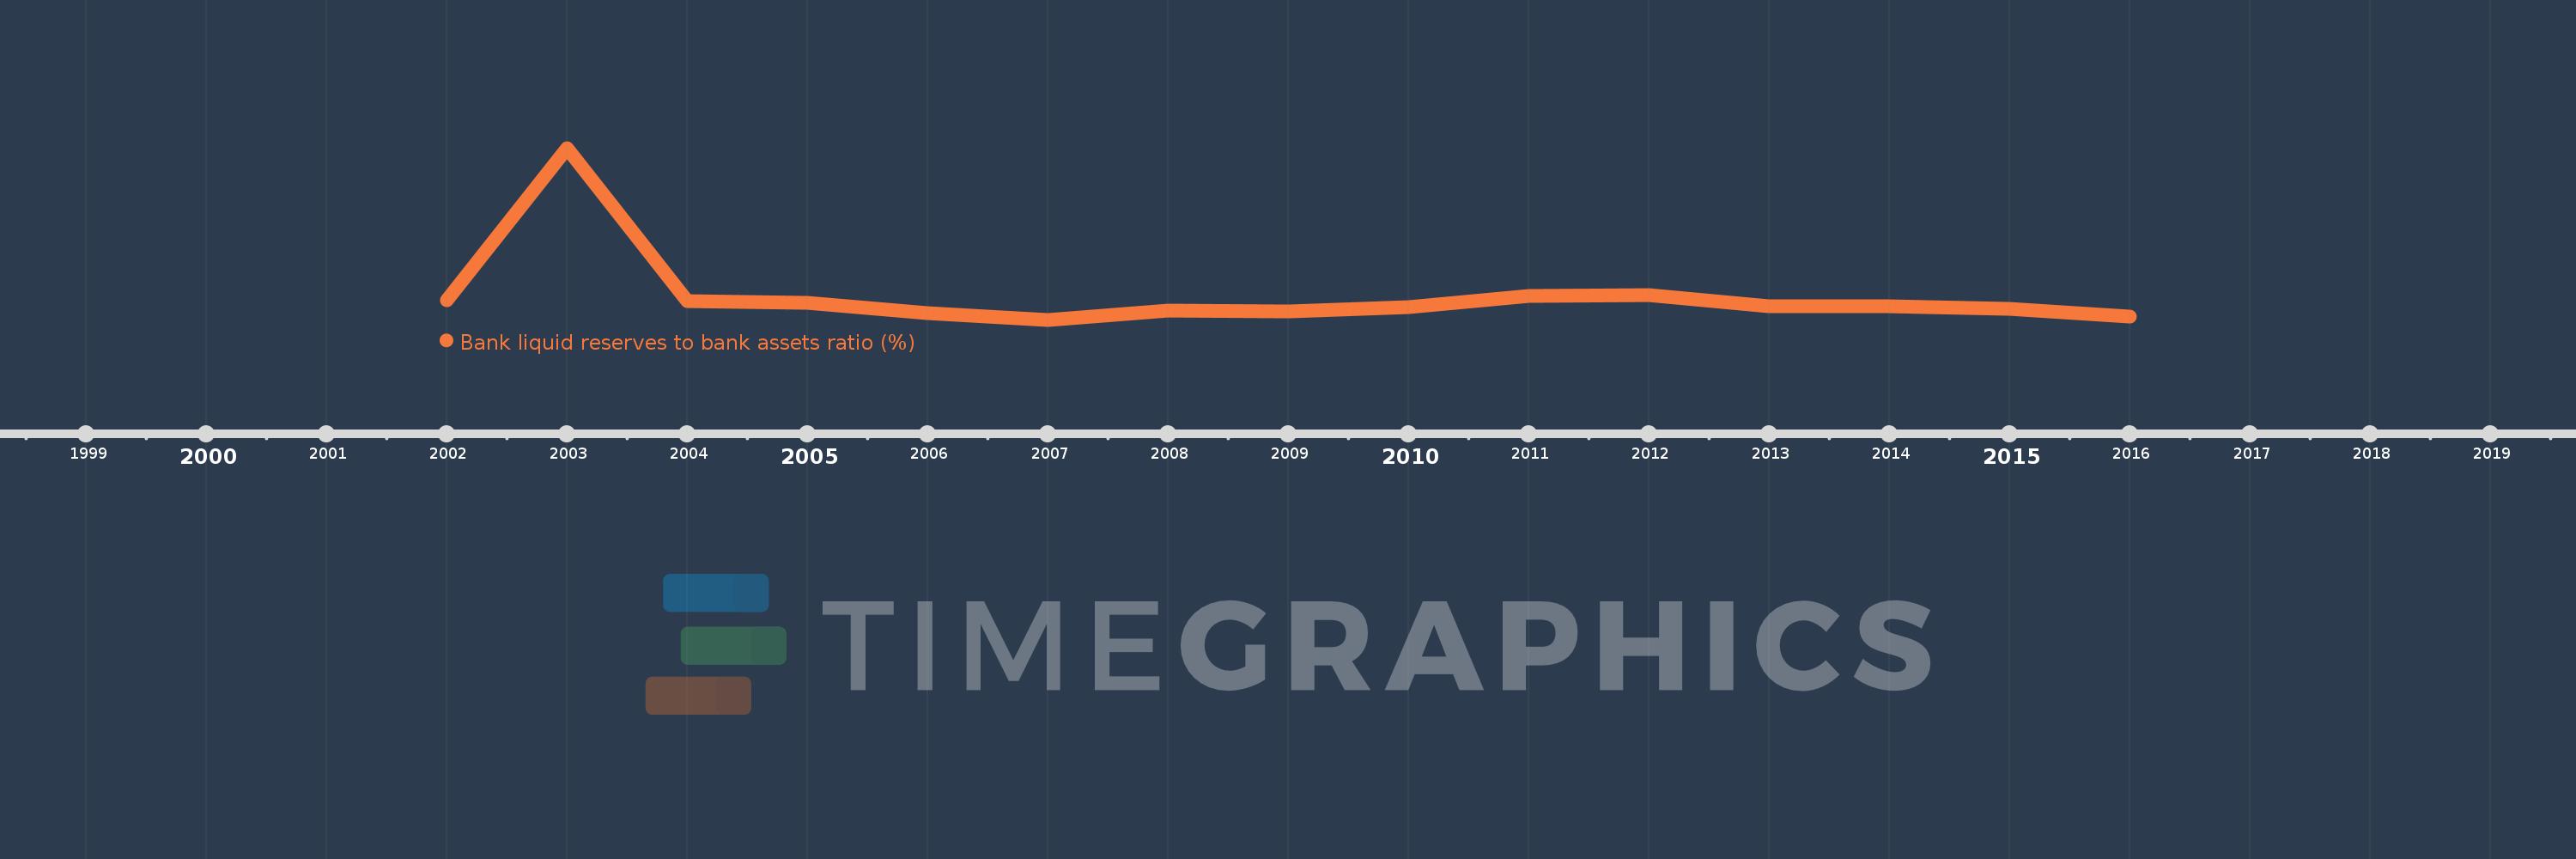
Bank liquid reserves to bank assets ratio (%)
2016,2015,2014,2013,2012,2011,2010,2009,2008,2007,2006,2005,2004,2003,2002
This statistics in other country:
Timeline:
This timeline shows a graph from 2002 to 2016 of South Africa. No data until 2001. Number of actual observations by date: 15.
Source name:
World Development Indicators
Source organization:
International Monetary Fund, International Financial Statistics and data files.
Categories, topics:
Financial Sector
Last updated:
apr 23, 2017
Indicators value changes by year
At the date of observation
Value
Absolute change
Change from previous value
jan 1, 2002
3.78
+3.78
0.0%
jan 1, 2003
9.653
+5.874
155.41%
jan 1, 2004
3.74
-5.913
-61.26%
jan 1, 2005
3.668
-0.072
-1.92%
jan 1, 2006
3.278
-0.39
-10.64%
jan 1, 2007
3.017
-0.261
-7.96%
jan 1, 2008
3.38
+0.363
12.02%
jan 1, 2009
3.346
-0.034
-1.0%
jan 1, 2010
3.502
+0.156
4.66%
jan 1, 2011
3.935
+0.432
12.35%
jan 1, 2012
3.981
+0.046
1.18%
jan 1, 2013
3.527
-0.454
-11.41%
jan 1, 2014
3.54
+0.013
0.38%
jan 1, 2015
3.453
-0.087
-2.46%
jan 1, 2016
3.138
-0.315
-9.11%
Ranking of countries by current statistics by years


Comments: